Distribution Acceptance Map [Harmony Algo]
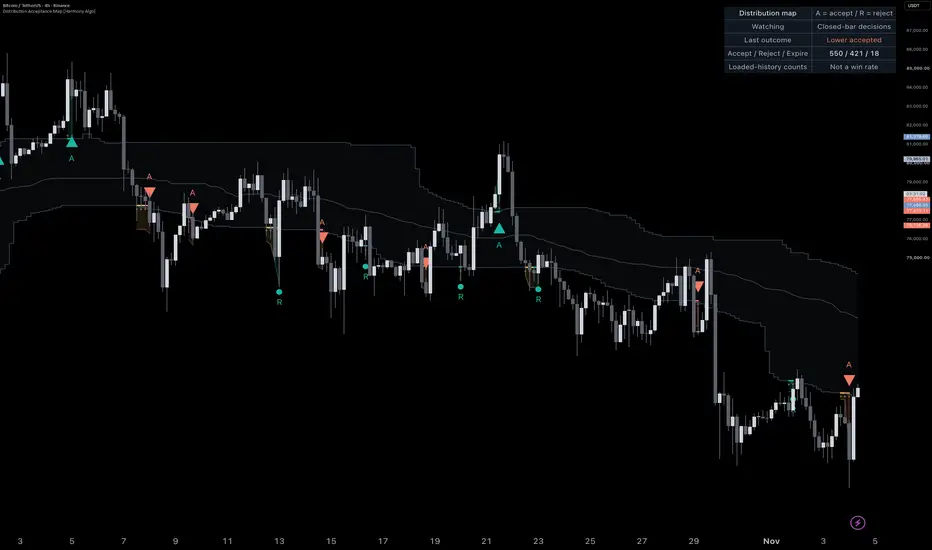
An excursion outside a recent price distribution can lead to continuation or return inside. Distribution Acceptance Map follows that decision as a short, bounded event: freeze the reference boundary, observe subsequent closes, then classify acceptance, rejection, or expiry. It is an overlay for reading breakout and reversal context, not a complete trading strategy.
THE REFERENCE MAP
The blue band is the empirical distribution of the previous 80 closing prices by default. Its edges are the 15th and 85th percentiles, calculated with linear interpolation. The center line is the median. The current candle is excluded from all three reference calculations. These percentiles describe the observed sample; they are not confidence intervals, forward probability estimates, or a promise that future prices will stay inside the band.
HOW AN EVENT STARTS
An upper event requires the previous close to be at or below the upper quantile and the current high to reach at least 0.25 prior-bar ATR above it. The lower event mirrors this rule. The excursion is recognized only when the candle closes. At that point, the relevant quantile and the prior-bar ATR are frozen for this event. The live reference band may continue moving, but it cannot move the active event's decision boundary.
Only one event is tracked at a time. If both boundaries qualify on the same starting candle, that candle is skipped: OHLC data cannot tell us which side was visited first. An active event keeps its original side even if price subsequently crosses the opposite rolling boundary.
ACCEPTANCE: TRIANGLE WITH A
The default is two consecutive closes beyond the frozen boundary plus an outward buffer of 0.15 frozen ATR. The excursion candle can count as the first close. Any close that fails this outside test resets the consecutive count.
A teal upward triangle means upper acceptance: price has held above the old upper boundary. A coral downward triangle means lower acceptance: price has held below the old lower boundary. Acceptance describes the completed holding test. It does not guarantee continuation, provide a price target, or retrospectively become rejection if the next candle reverses.
REJECTION: CIRCLE WITH R
An upper rejection requires a close below the frozen upper boundary minus the inward 0.15 ATR buffer. That candle must also close in the lower 40% of its own range by default. A coral circle above the bar marks this downward outcome.
A lower rejection requires a close above the frozen lower boundary plus the inward buffer, with the close in the upper 40% of its range. A teal circle below the bar marks this upward outcome. The close-strength calculation uses (high - close)/(high - low) for upper rejection and its mirror for lower rejection, with a minimum-tick denominator guard. Rejection can resolve on the excursion candle itself. It describes a return through the old boundary, not a guaranteed reversal.
PENDING AND EXPIRED EVENTS
Amber rails show the frozen boundary, outward acceptance threshold, and running excursion extreme, updated on confirmed closes. The shaded area shows how far price has explored beyond the boundary. Resolved rails take the outcome color on the resolution candle. An unresolved event expires after six candles including its starting candle; a gray cross marks expiry. A qualifying acceptance or rejection on that sixth candle takes precedence over expiry. Four full bars are skipped after a completed event before another can start.
HOW TO READ IT
First locate the recent distribution and its median. Then distinguish a pending excursion from a completed A or R. An A can help frame a continuation hypothesis; an R can help frame a return-toward-range hypothesis. Check broader market context and define risk independently. The map supplies no entries, exits, sizing, stop loss, take profit, or transaction-cost model. Repeated counter-direction R markers during a strong trend are a reason for caution, not an instruction to keep fading the trend.
The panel reports the current state, most recent event outcome, and accepted/rejected/expired counts across loaded chart history. Those counts are NOT trades, wins, accuracy, or a backtest. Loading more history, changing the chart, or changing settings can change the totals. Skipped dual excursions and an outcome code are also available in the Data Window: +1 upper acceptance, -1 lower acceptance, +2 lower rejection, -2 upper rejection, 3 expiry, and 0 no outcome on that candle.
SETTINGS
Reference bars and tail percentile control the sample and boundary positions. ATR length normalizes excursion and decision distances. A larger minimum excursion requires a deeper probe. A wider decision buffer demands more separation from the boundary. More acceptance closes require longer holding. The decision window limits how long an event can remain pending. Rejection close strength filters the resolution candle's location within its own range. Cooldown limits event repetition. The band, panel, and outcome colors can be adjusted. At least the requested reference and ATR history must be available; a zero-width reference distribution or nonpositive ATR cannot start an event.
SIGNAL TIMING, ALERTS, AND REPAINT BEHAVIOR
All event state changes and A/R markers are gated by confirmed chart-bar closes. No pivot is backdated, no negative offset is used, and no other timeframe or external series is requested. The reference calculations use prior bars. On an open candle, no new event decision is committed; pending rails retain their last confirmed state.
Four named alert conditions match the four A/R marker booleans. A fifth, Any resolved direction, combines them and excludes expiry. Use the named event conditions with Once Per Bar Close and keep the alert interval the same as the chart interval. Recreate alerts after changing code, inputs, symbol, or interval because saved alerts use their own snapshot. TradingView displayed its repaint caution during the alert-menu check. This release retains the confirmed-close logic described above; the warning should not be interpreted as an independently verified guarantee either way. End-to-end delivery of a live alert was not tested in this release.
Closed-bar outputs are intended to reproduce with the same data, settings, and calculation history. Data-feed corrections, different sessions, adjusted prices, changes in loaded history, and changed inputs can alter historical calculations. Use standard candles. Synthetic chart types produce synthetic prices and change the meaning of the map.
DISTINCTIVE DESIGN AND LIMITATIONS
This implementation joins an empirical prior-close distribution to a frozen, finite-lifetime event decision. It distinguishes outward acceptance from inward rejection rather than treating every band touch as a reversal. The frozen reference and ATR keep the goalposts fixed during the event; the dead band, consecutive-close reset, explicit expiry, ambiguous-start skip, and cooldown define how indecision is handled. No source code was copied from another community script.
The distribution can lag abrupt regime changes. Gaps can jump through boundaries. Acceptance adds confirmation delay and may occur near exhaustion. Rejections can fail in persistent trends, and choppy markets can produce opposing outcomes. The tool does not identify actual resting orders, liquidations, institutional activity, or order-book liquidity; it uses chart OHLC prices only and requires no volume data. No parameters are claimed optimal for a market or timeframe, and no profitability or predictive-accuracy claim is made.
THE REFERENCE MAP
The blue band is the empirical distribution of the previous 80 closing prices by default. Its edges are the 15th and 85th percentiles, calculated with linear interpolation. The center line is the median. The current candle is excluded from all three reference calculations. These percentiles describe the observed sample; they are not confidence intervals, forward probability estimates, or a promise that future prices will stay inside the band.
HOW AN EVENT STARTS
An upper event requires the previous close to be at or below the upper quantile and the current high to reach at least 0.25 prior-bar ATR above it. The lower event mirrors this rule. The excursion is recognized only when the candle closes. At that point, the relevant quantile and the prior-bar ATR are frozen for this event. The live reference band may continue moving, but it cannot move the active event's decision boundary.
Only one event is tracked at a time. If both boundaries qualify on the same starting candle, that candle is skipped: OHLC data cannot tell us which side was visited first. An active event keeps its original side even if price subsequently crosses the opposite rolling boundary.
ACCEPTANCE: TRIANGLE WITH A
The default is two consecutive closes beyond the frozen boundary plus an outward buffer of 0.15 frozen ATR. The excursion candle can count as the first close. Any close that fails this outside test resets the consecutive count.
A teal upward triangle means upper acceptance: price has held above the old upper boundary. A coral downward triangle means lower acceptance: price has held below the old lower boundary. Acceptance describes the completed holding test. It does not guarantee continuation, provide a price target, or retrospectively become rejection if the next candle reverses.
REJECTION: CIRCLE WITH R
An upper rejection requires a close below the frozen upper boundary minus the inward 0.15 ATR buffer. That candle must also close in the lower 40% of its own range by default. A coral circle above the bar marks this downward outcome.
A lower rejection requires a close above the frozen lower boundary plus the inward buffer, with the close in the upper 40% of its range. A teal circle below the bar marks this upward outcome. The close-strength calculation uses (high - close)/(high - low) for upper rejection and its mirror for lower rejection, with a minimum-tick denominator guard. Rejection can resolve on the excursion candle itself. It describes a return through the old boundary, not a guaranteed reversal.
PENDING AND EXPIRED EVENTS
Amber rails show the frozen boundary, outward acceptance threshold, and running excursion extreme, updated on confirmed closes. The shaded area shows how far price has explored beyond the boundary. Resolved rails take the outcome color on the resolution candle. An unresolved event expires after six candles including its starting candle; a gray cross marks expiry. A qualifying acceptance or rejection on that sixth candle takes precedence over expiry. Four full bars are skipped after a completed event before another can start.
HOW TO READ IT
First locate the recent distribution and its median. Then distinguish a pending excursion from a completed A or R. An A can help frame a continuation hypothesis; an R can help frame a return-toward-range hypothesis. Check broader market context and define risk independently. The map supplies no entries, exits, sizing, stop loss, take profit, or transaction-cost model. Repeated counter-direction R markers during a strong trend are a reason for caution, not an instruction to keep fading the trend.
The panel reports the current state, most recent event outcome, and accepted/rejected/expired counts across loaded chart history. Those counts are NOT trades, wins, accuracy, or a backtest. Loading more history, changing the chart, or changing settings can change the totals. Skipped dual excursions and an outcome code are also available in the Data Window: +1 upper acceptance, -1 lower acceptance, +2 lower rejection, -2 upper rejection, 3 expiry, and 0 no outcome on that candle.
SETTINGS
Reference bars and tail percentile control the sample and boundary positions. ATR length normalizes excursion and decision distances. A larger minimum excursion requires a deeper probe. A wider decision buffer demands more separation from the boundary. More acceptance closes require longer holding. The decision window limits how long an event can remain pending. Rejection close strength filters the resolution candle's location within its own range. Cooldown limits event repetition. The band, panel, and outcome colors can be adjusted. At least the requested reference and ATR history must be available; a zero-width reference distribution or nonpositive ATR cannot start an event.
SIGNAL TIMING, ALERTS, AND REPAINT BEHAVIOR
All event state changes and A/R markers are gated by confirmed chart-bar closes. No pivot is backdated, no negative offset is used, and no other timeframe or external series is requested. The reference calculations use prior bars. On an open candle, no new event decision is committed; pending rails retain their last confirmed state.
Four named alert conditions match the four A/R marker booleans. A fifth, Any resolved direction, combines them and excludes expiry. Use the named event conditions with Once Per Bar Close and keep the alert interval the same as the chart interval. Recreate alerts after changing code, inputs, symbol, or interval because saved alerts use their own snapshot. TradingView displayed its repaint caution during the alert-menu check. This release retains the confirmed-close logic described above; the warning should not be interpreted as an independently verified guarantee either way. End-to-end delivery of a live alert was not tested in this release.
Closed-bar outputs are intended to reproduce with the same data, settings, and calculation history. Data-feed corrections, different sessions, adjusted prices, changes in loaded history, and changed inputs can alter historical calculations. Use standard candles. Synthetic chart types produce synthetic prices and change the meaning of the map.
DISTINCTIVE DESIGN AND LIMITATIONS
This implementation joins an empirical prior-close distribution to a frozen, finite-lifetime event decision. It distinguishes outward acceptance from inward rejection rather than treating every band touch as a reversal. The frozen reference and ATR keep the goalposts fixed during the event; the dead band, consecutive-close reset, explicit expiry, ambiguous-start skip, and cooldown define how indecision is handled. No source code was copied from another community script.
The distribution can lag abrupt regime changes. Gaps can jump through boundaries. Acceptance adds confirmation delay and may occur near exhaustion. Rejections can fail in persistent trends, and choppy markets can produce opposing outcomes. The tool does not identify actual resting orders, liquidations, institutional activity, or order-book liquidity; it uses chart OHLC prices only and requires no volume data. No parameters are claimed optimal for a market or timeframe, and no profitability or predictive-accuracy claim is made.

Elevate Your Trading ▶ qalphatrade.com
Trade with mathematical certainty,
not emotional guesswork.
Trade with mathematical certainty,
not emotional guesswork.
Thông báo miễn trừ trách nhiệm
Thông tin và các ấn phẩm này không nhằm mục đích, và không cấu thành, lời khuyên hoặc khuyến nghị về tài chính, đầu tư, giao dịch hay các loại khác do TradingView cung cấp hoặc xác nhận. Đọc thêm tại Điều khoản Sử dụng.
Elevate Your Trading ▶ qalphatrade.com
Trade with mathematical certainty,
not emotional guesswork.
Trade with mathematical certainty,
not emotional guesswork.
Thông báo miễn trừ trách nhiệm
Thông tin và các ấn phẩm này không nhằm mục đích, và không cấu thành, lời khuyên hoặc khuyến nghị về tài chính, đầu tư, giao dịch hay các loại khác do TradingView cung cấp hoặc xác nhận. Đọc thêm tại Điều khoản Sử dụng.