OPEN-SOURCE SCRIPT
KOCA IB STATS
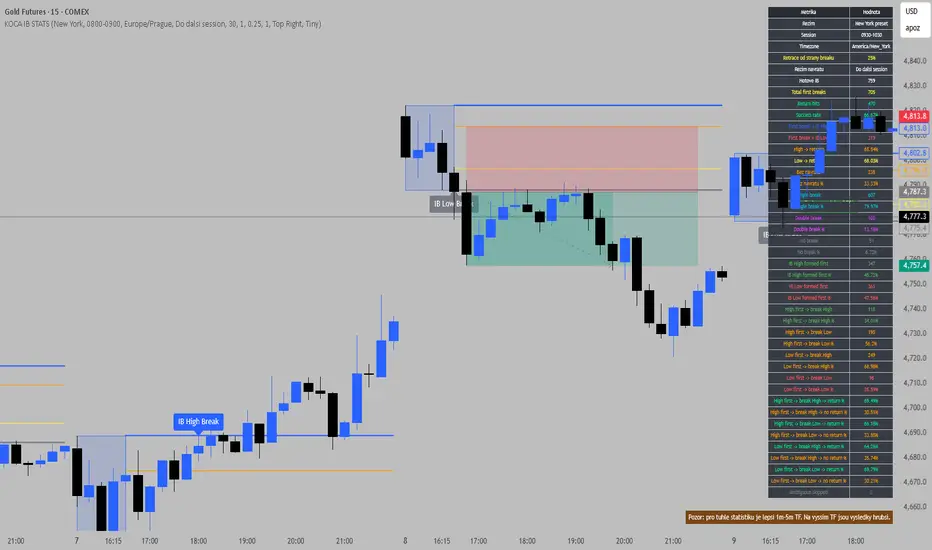
IB Statistics - Overlay
Advanced statistical indicator for Initial Balance (IB), focused on analyzing what price does after the IB is formed during London or New York sessions, or any custom session.
This is not just a visual IB tool — it’s a data-driven edge finder.
What this indicator does:
Draws IB High and IB Low
Displays IB box with customizable colors
Plots dynamic retrace levels based on selected percentage
Detects first break (IB High / IB Low)
Tracks whether price returns to the selected retrace level
Supports return windows:
Minutes
Hours
Until next session
Classifies daily behavior:
Single break
Double break
No break
No return
Tracks which side of IB was formed first (High or Low)
Provides conditional statistics such as:
High formed first → what breaks first
Low formed first → what breaks first
Measures continuation vs retrace probabilities after specific setups
Key insight this tool provides:
This indicator connects multiple layers of context:
How IB was formed
Which side breaks first
Whether price retraces or continues
Instead of guessing, you get real statistical probabilities for:
continuation trades
fade setups
IB-based strategies
Session modes:
London (preset)
New York (preset)
Custom session
Presets use correct timezones:
Europe/London
America/New_York
This means DST (summer/winter time shifts are handled correctly) — no manual adjustments needed.
Best usage:
For accurate results, use on lower timeframes:
1m
3m
5m
Higher timeframes will produce less precise statistics due to candle aggregation.
Who is this for:
Traders who want to move beyond visual IB trading and actually understand:
what happens after a breakout
when continuation is more likely
when retrace setups have higher probability
Core idea:
This indicator answers questions like:
If IB High forms first, what is more likely to break?
After a High break, does price usually continue or retrace?
How often does price fail to return?
What percentage of days produce clean vs messy behavior?
Short description (for quick publish):
Advanced Initial Balance (IB) statistical tool. Tracks IB formation, first break behavior, retrace probabilities, and continuation patterns across London, New York, or custom sessions. Designed to turn IB trading into a data-driven strategy. Best used on 1m–5m timeframe.
Advanced statistical indicator for Initial Balance (IB), focused on analyzing what price does after the IB is formed during London or New York sessions, or any custom session.
This is not just a visual IB tool — it’s a data-driven edge finder.
What this indicator does:
Draws IB High and IB Low
Displays IB box with customizable colors
Plots dynamic retrace levels based on selected percentage
Detects first break (IB High / IB Low)
Tracks whether price returns to the selected retrace level
Supports return windows:
Minutes
Hours
Until next session
Classifies daily behavior:
Single break
Double break
No break
No return
Tracks which side of IB was formed first (High or Low)
Provides conditional statistics such as:
High formed first → what breaks first
Low formed first → what breaks first
Measures continuation vs retrace probabilities after specific setups
Key insight this tool provides:
This indicator connects multiple layers of context:
How IB was formed
Which side breaks first
Whether price retraces or continues
Instead of guessing, you get real statistical probabilities for:
continuation trades
fade setups
IB-based strategies
Session modes:
London (preset)
New York (preset)
Custom session
Presets use correct timezones:
Europe/London
America/New_York
This means DST (summer/winter time shifts are handled correctly) — no manual adjustments needed.
Best usage:
For accurate results, use on lower timeframes:
1m
3m
5m
Higher timeframes will produce less precise statistics due to candle aggregation.
Who is this for:
Traders who want to move beyond visual IB trading and actually understand:
what happens after a breakout
when continuation is more likely
when retrace setups have higher probability
Core idea:
This indicator answers questions like:
If IB High forms first, what is more likely to break?
After a High break, does price usually continue or retrace?
How often does price fail to return?
What percentage of days produce clean vs messy behavior?
Short description (for quick publish):
Advanced Initial Balance (IB) statistical tool. Tracks IB formation, first break behavior, retrace probabilities, and continuation patterns across London, New York, or custom sessions. Designed to turn IB trading into a data-driven strategy. Best used on 1m–5m timeframe.
Mã nguồn mở
Theo đúng tinh thần TradingView, tác giả của tập lệnh này đã công bố nó dưới dạng mã nguồn mở, để các nhà giao dịch có thể xem xét và xác minh chức năng. Chúc mừng tác giả! Mặc dù bạn có thể sử dụng miễn phí, hãy nhớ rằng việc công bố lại mã phải tuân theo Nội quy.

Thông báo miễn trừ trách nhiệm
Thông tin và các ấn phẩm này không nhằm mục đích, và không cấu thành, lời khuyên hoặc khuyến nghị về tài chính, đầu tư, giao dịch hay các loại khác do TradingView cung cấp hoặc xác nhận. Đọc thêm tại Điều khoản Sử dụng.
Mã nguồn mở
Theo đúng tinh thần TradingView, tác giả của tập lệnh này đã công bố nó dưới dạng mã nguồn mở, để các nhà giao dịch có thể xem xét và xác minh chức năng. Chúc mừng tác giả! Mặc dù bạn có thể sử dụng miễn phí, hãy nhớ rằng việc công bố lại mã phải tuân theo Nội quy.
Thông báo miễn trừ trách nhiệm
Thông tin và các ấn phẩm này không nhằm mục đích, và không cấu thành, lời khuyên hoặc khuyến nghị về tài chính, đầu tư, giao dịch hay các loại khác do TradingView cung cấp hoặc xác nhận. Đọc thêm tại Điều khoản Sử dụng.