OPEN-SOURCE SCRIPT
Cập nhật Previous Day/Week/Month High/Low
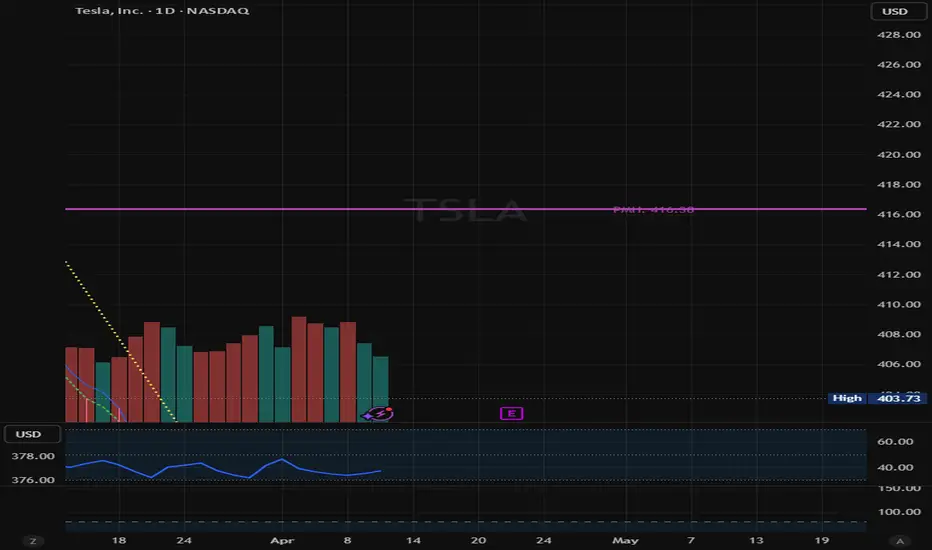
This script plots the previous day, week and month high and low.
Phát hành các Ghi chú
//version=6indicator("True Anchor H/L - Always-On Build", overlay=true, max_bars_back=5000)
// --- HELPER FUNCTION: Convert String to Line Style ---
getStyle(s) =>
s == "Dashed" ? line.style_dashed : s == "Dotted" ? line.style_dotted : line.style_solid
// --- GUI INPUTS ---
grp_g = "Global Settings"
label_off = input.int(6, "Label Vertical Offset (Ticks)", minval=0, group=grp_g)
// 10-Minute
grp_10 = "10-Minute Levels"
show_10 = input.bool(true, "Show P10mH/P10mL", group=grp_10)
col_10 = input.color(#9598a1, "Color", group=grp_10)
wid_10 = input.int(1, "Weight", minval=1, maxval=5, group=grp_10)
sty_10 = input.string("Solid", "Style", options=["Solid", "Dashed", "Dotted"], group=grp_10)
// Hourly
grp_h = "Hour Levels"
show_h = input.bool(true, "Show PHH/PHL", group=grp_h)
col_h = input.color(#ff9800, "Color", group=grp_h)
wid_h = input.int(1, "Weight", minval=1, maxval=5, group=grp_h)
sty_h = input.string("Solid", "Style", options=["Solid", "Dashed", "Dotted"], group=grp_h)
// Daily
grp_d = "Daily Levels"
show_d = input.bool(true, "Show Daily PDH/PDL", group=grp_d)
col_d = input.color(#86c7e6, "Color", group=grp_d)
wid_d = input.int(1, "Weight", minval=1, maxval=5, group=grp_d)
sty_d = input.string("Solid", "Style", options=["Solid", "Dashed", "Dotted"], group=grp_d)
// Weekly
grp_w = "Weekly Levels"
show_w = input.bool(true, "Show PWH/PWL", group=grp_w)
col_w = input.color(#e4bec4, "Color", group=grp_w)
wid_w = input.int(2, "Weight", minval=1, maxval=5, group=grp_w)
sty_w = input.string("Solid", "Style", options=["Solid", "Dashed", "Dotted"], group=grp_w)
// Monthly
grp_m = "Monthly Levels"
show_m = input.bool(true, "Show Monthly PMH/PML", group=grp_m)
col_m = input.color(#ac43ac, "Color", group=grp_m)
wid_m = input.int(2, "Weight", minval=1, maxval=5, group=grp_m)
sty_m = input.string("Solid", "Style", options=["Solid", "Dashed", "Dotted"], group=grp_m)
// --- 1. Fetch Price Levels ---
p10h = request.security(syminfo.tickerid, "10", high[1], lookahead=barmerge.lookahead_on)
p10l = request.security(syminfo.tickerid, "10", low[1], lookahead=barmerge.lookahead_on)
phh = request.security(syminfo.tickerid, "60", high[1], lookahead=barmerge.lookahead_on)
phl = request.security(syminfo.tickerid, "60", low[1], lookahead=barmerge.lookahead_on)
phd = request.security(syminfo.tickerid, "D", high[1], lookahead=barmerge.lookahead_on)
pld = request.security(syminfo.tickerid, "D", low[1], lookahead=barmerge.lookahead_on)
phw = request.security(syminfo.tickerid, "W", high[1], lookahead=barmerge.lookahead_on)
plw = request.security(syminfo.tickerid, "W", low[1], lookahead=barmerge.lookahead_on)
phm = request.security(syminfo.tickerid, "M", high[1], lookahead=barmerge.lookahead_on)
plm = request.security(syminfo.tickerid, "M", low[1], lookahead=barmerge.lookahead_on)
// --- 2. Anchoring Logic ---
tenMinAnchor = ta.valuewhen(ta.change(time("10")) != 0, bar_index, 1)
hourAnchor = ta.valuewhen(ta.change(time("60")) != 0, bar_index, 1)
dayAnchor = ta.valuewhen(ta.change(time("D")) != 0, bar_index, 1)
weekAnchor = ta.valuewhen(ta.change(time("W")) != 0, bar_index, 1)
monthAnchor = ta.valuewhen(ta.change(time("M")) != 0, bar_index, 1)
// --- 3. Drawing Function ---
drawLevel(anchorBar, price, useColor, width, styleStr, labelText, xOffset, isVisible) =>
if isVisible and not na(price) and not na(anchorBar)
int startX = int(anchorBar)
int endX = bar_index
if startX >= endX
startX := endX - 1
line.new(startX, price, endX, price, xloc.bar_index, extend.right, useColor, style=getStyle(styleStr), width=width, force_overlay=true)
float labelY = price - (syminfo.mintick * label_off)
label.new(x=endX + xOffset, y=labelY, text=labelText, xloc=xloc.bar_index, color=color(na), textcolor=useColor, style=label.style_label_left, size=size.small, force_overlay=true)
// --- 4. Execution ---
if barstate.islast
// Cleanup
line_arr = line.all
if array.size(line_arr) > 0
for i = 0 to array.size(line_arr) - 1
line.delete(array.get(line_arr, i))
label_arr = label.all
if array.size(label_arr) > 0
for i = 0 to array.size(label_arr) - 1
label.delete(array.get(label_arr, i))
// Render Logic (Filters removed to ensure visibility on all timeframes)
drawLevel(tenMinAnchor, p10h, col_10, wid_10, sty_10, "P10mH", 1, show_10)
drawLevel(tenMinAnchor, p10l, col_10, wid_10, sty_10, "P10mL", 1, show_10)
drawLevel(hourAnchor, phh, col_h, wid_h, sty_h, "PHH", 4, show_h)
drawLevel(hourAnchor, phl, col_h, wid_h, sty_h, "PHL", 4, show_h)
drawLevel(dayAnchor, phd, col_d, wid_d, sty_d, "PDH", 7, show_d)
drawLevel(dayAnchor, pld, col_d, wid_d, sty_d, "PDL", 7, show_d)
drawLevel(weekAnchor, phw, col_w, wid_w, sty_w, "PWH", 10, show_w)
drawLevel(weekAnchor, plw, col_w, wid_w, sty_w, "PWL", 10, show_w)
drawLevel(monthAnchor, phm, col_m, wid_m, sty_m, "PMH", 13, show_m)
drawLevel(monthAnchor, plm, col_m, wid_m, sty_m, "PML", 13, show_m)
Phát hành các Ghi chú
This will help you plot previous high timeframe levels automatically.you can change line style, weight and text placement.
this will only show smaller time frames when you go to that time frame (i.e. the 1H will only show the 1D, 1W and 1M levels while the 10m frame will also plot the 10m levels)
Phát hành các Ghi chú
.Mã nguồn mở
Theo đúng tinh thần TradingView, tác giả của tập lệnh này đã công bố nó dưới dạng mã nguồn mở, để các nhà giao dịch có thể xem xét và xác minh chức năng. Chúc mừng tác giả! Mặc dù bạn có thể sử dụng miễn phí, hãy nhớ rằng việc công bố lại mã phải tuân theo Nội quy.

Thông báo miễn trừ trách nhiệm
Thông tin và các ấn phẩm này không nhằm mục đích, và không cấu thành, lời khuyên hoặc khuyến nghị về tài chính, đầu tư, giao dịch hay các loại khác do TradingView cung cấp hoặc xác nhận. Đọc thêm tại Điều khoản Sử dụng.
Mã nguồn mở
Theo đúng tinh thần TradingView, tác giả của tập lệnh này đã công bố nó dưới dạng mã nguồn mở, để các nhà giao dịch có thể xem xét và xác minh chức năng. Chúc mừng tác giả! Mặc dù bạn có thể sử dụng miễn phí, hãy nhớ rằng việc công bố lại mã phải tuân theo Nội quy.
Thông báo miễn trừ trách nhiệm
Thông tin và các ấn phẩm này không nhằm mục đích, và không cấu thành, lời khuyên hoặc khuyến nghị về tài chính, đầu tư, giao dịch hay các loại khác do TradingView cung cấp hoặc xác nhận. Đọc thêm tại Điều khoản Sử dụng.