Momentum
1. What Is the Basic Logic?
Momentum is calculated simply based on the difference (or ratio) between the current price and the price X days ago.
Prices may be rising, but if the pace of the increase slows down, momentum begins to fall. This suggests that the trend might be losing steam.
Conversely, if a decline begins to lose speed, momentum starts to recover.
2. How Is It Interpreted in the Market?
A. Zero-Line Crossovers (Trend Direction)
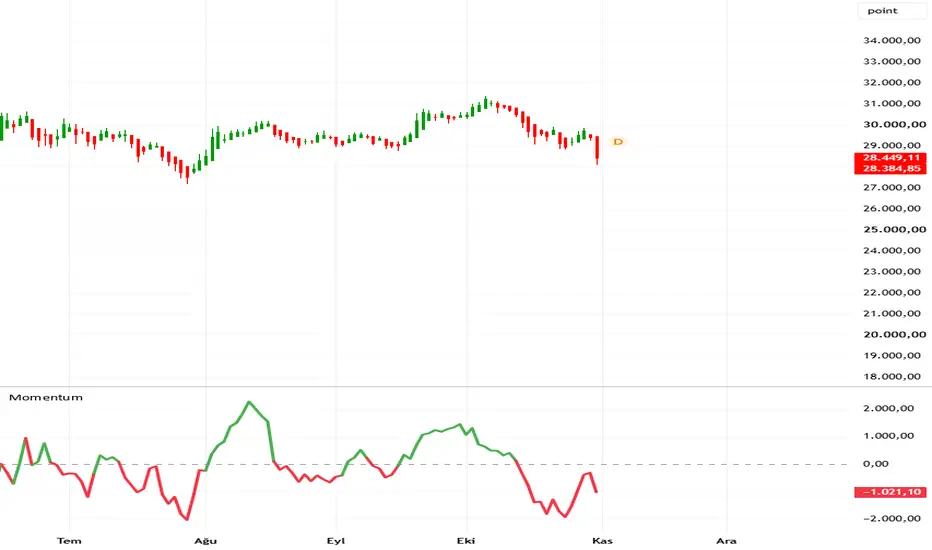
Above the Zero Line (Green Zone): Indicates that the bulls (buyers) are in control and that prices are at higher levels compared to the past. This supports an uptrend.
Below the Zero Line (Red Zone): Indicates that the bears (sellers) are dominant and that prices have retreated compared to the past period. This supports a downtrend.
Crossing the Zero Line:
Crossing the zero line from below to above is interpreted as an increase in buying appetite.
Crossing the zero line from above to below is interpreted as an intensification of selling pressure.
B. Divergences – One of the Strongest Signals
One of the most valuable applications of momentum is identifying divergences between the indicator and the price:
Bullish Divergence (Positive): If prices reach a new low on the chart while the momentum indicator forms a higher low, it suggests that the speed of the decline is slowing and a potential upward reversal (a rebound) may be on the horizon.
Bearish Divergence (Negative): If prices reach a new high while the momentum indicator forms a lower high, it suggests that the upward momentum is weakening. ...indicates that the upward momentum is fading and the trend is weakening (with an increased risk of a decline).
C. Momentum Shifts (Peaks and Troughs)
Sharp peaks or deep troughs within the indicator itself reflect states of extreme market exuberance or panic. When the line begins to flatten out at an extreme high level, it can be inferred that the momentum behind the movement has been exhausted.
3. For What Purpose Is It Used?
Trend Confirmation: To determine whether an existing trend is continuing with strength.
Early Warning (Filtering): To detect potential trend reversals slightly sooner than price action alone might suggest.
In Conjunction with Other Tools: It is typically used for confirmation alongside indicators such as the MACD, RSI, moving averages, or support/resistance levels (using it in isolation may lead to misleading signals).
Momentum is calculated simply based on the difference (or ratio) between the current price and the price X days ago.
Prices may be rising, but if the pace of the increase slows down, momentum begins to fall. This suggests that the trend might be losing steam.
Conversely, if a decline begins to lose speed, momentum starts to recover.
2. How Is It Interpreted in the Market?
A. Zero-Line Crossovers (Trend Direction)
Above the Zero Line (Green Zone): Indicates that the bulls (buyers) are in control and that prices are at higher levels compared to the past. This supports an uptrend.
Below the Zero Line (Red Zone): Indicates that the bears (sellers) are dominant and that prices have retreated compared to the past period. This supports a downtrend.
Crossing the Zero Line:
Crossing the zero line from below to above is interpreted as an increase in buying appetite.
Crossing the zero line from above to below is interpreted as an intensification of selling pressure.
B. Divergences – One of the Strongest Signals
One of the most valuable applications of momentum is identifying divergences between the indicator and the price:
Bullish Divergence (Positive): If prices reach a new low on the chart while the momentum indicator forms a higher low, it suggests that the speed of the decline is slowing and a potential upward reversal (a rebound) may be on the horizon.
Bearish Divergence (Negative): If prices reach a new high while the momentum indicator forms a lower high, it suggests that the upward momentum is weakening. ...indicates that the upward momentum is fading and the trend is weakening (with an increased risk of a decline).
C. Momentum Shifts (Peaks and Troughs)
Sharp peaks or deep troughs within the indicator itself reflect states of extreme market exuberance or panic. When the line begins to flatten out at an extreme high level, it can be inferred that the momentum behind the movement has been exhausted.
3. For What Purpose Is It Used?
Trend Confirmation: To determine whether an existing trend is continuing with strength.
Early Warning (Filtering): To detect potential trend reversals slightly sooner than price action alone might suggest.
In Conjunction with Other Tools: It is typically used for confirmation alongside indicators such as the MACD, RSI, moving averages, or support/resistance levels (using it in isolation may lead to misleading signals).

Thông báo miễn trừ trách nhiệm
Thông tin và các ấn phẩm này không nhằm mục đích, và không cấu thành, lời khuyên hoặc khuyến nghị về tài chính, đầu tư, giao dịch hay các loại khác do TradingView cung cấp hoặc xác nhận. Đọc thêm tại Điều khoản Sử dụng.
Thông báo miễn trừ trách nhiệm
Thông tin và các ấn phẩm này không nhằm mục đích, và không cấu thành, lời khuyên hoặc khuyến nghị về tài chính, đầu tư, giao dịch hay các loại khác do TradingView cung cấp hoặc xác nhận. Đọc thêm tại Điều khoản Sử dụng.