OPEN-SOURCE SCRIPT
RM-SOR Zones Heatmap
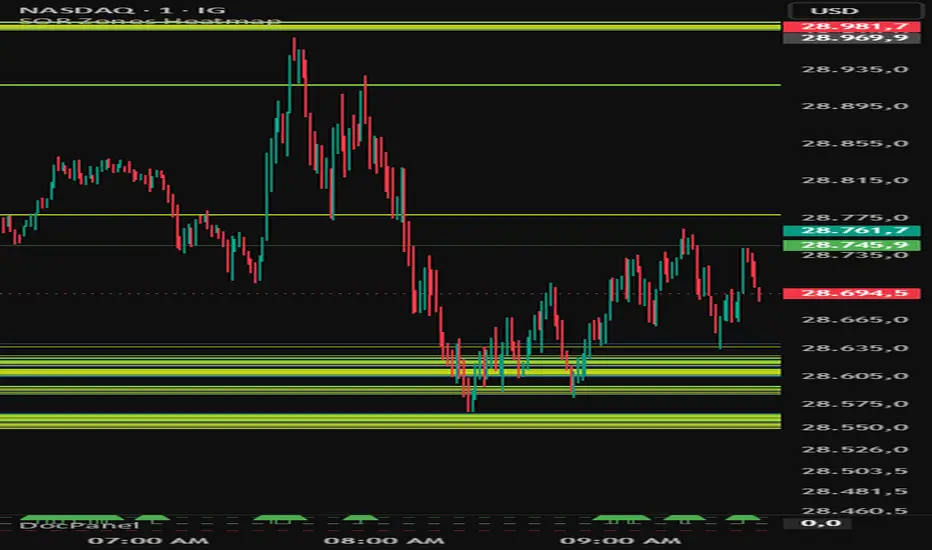
RM. "SOR Zones Heatmap" automatically maps the strongest Support/Resistance zones on any chart by scanning historical price and counting how many times each level was touched. Instead of drawing lines by hand, it highlights the areas where price has reacted the most — colored by strength — so you instantly see where the market respects a level.
Features
Automatic S/R detection: scans a configurable number of candles and clusters nearby touches into zones.
Strength heatmap: each zone is colored green (weak) → yellow (medium) → red (strong) based on how many times price hit it.
Full-width zone bands extended to the right, so levels stay visible as new candles form.
Central line per zone (style, width, and opacity configurable).
Smart labels: price, strength tier (WEAK / MEDIUM / STRONG), score, and touch count.
Fully customizable: colors, opacity, borders, zone size, and max zones to display.
Key Settings
Candles to analyze: lookback depth for building zones.
Minimum touches: filters out weak, noisy levels.
Zone size (pips): tolerance for clustering nearby touches into one zone.
Max zones to draw: caps how many levels appear on the chart.
Band / Line / Label groups: full control over appearance.
How to Use
Read the red zones as the strongest reaction areas — key decision levels.
Use yellow/green zones as secondary levels for scaling out or partial take-profits.
Combine with your trend bias: reactions off strong zones in the trend direction offer the cleanest setups.
Tips
On lower timeframes (e.g. 1min), lower the zone size for finer levels and raise the minimum touches to cut noise.
On higher timeframes, increase zone size so scattered touches merge into meaningful areas.
Created by Raúl (RM) (@your_username) · © 2026
All rights reserved. Educational use only.
Technical analysis tool for educational purposes only. This is not financial advice and does not guarantee results. Trade at your own risk.
Features
Automatic S/R detection: scans a configurable number of candles and clusters nearby touches into zones.
Strength heatmap: each zone is colored green (weak) → yellow (medium) → red (strong) based on how many times price hit it.
Full-width zone bands extended to the right, so levels stay visible as new candles form.
Central line per zone (style, width, and opacity configurable).
Smart labels: price, strength tier (WEAK / MEDIUM / STRONG), score, and touch count.
Fully customizable: colors, opacity, borders, zone size, and max zones to display.
Key Settings
Candles to analyze: lookback depth for building zones.
Minimum touches: filters out weak, noisy levels.
Zone size (pips): tolerance for clustering nearby touches into one zone.
Max zones to draw: caps how many levels appear on the chart.
Band / Line / Label groups: full control over appearance.
How to Use
Read the red zones as the strongest reaction areas — key decision levels.
Use yellow/green zones as secondary levels for scaling out or partial take-profits.
Combine with your trend bias: reactions off strong zones in the trend direction offer the cleanest setups.
Tips
On lower timeframes (e.g. 1min), lower the zone size for finer levels and raise the minimum touches to cut noise.
On higher timeframes, increase zone size so scattered touches merge into meaningful areas.
Created by Raúl (RM) (@your_username) · © 2026
All rights reserved. Educational use only.
Technical analysis tool for educational purposes only. This is not financial advice and does not guarantee results. Trade at your own risk.
Mã nguồn mở
Theo đúng tinh thần TradingView, tác giả của tập lệnh này đã công bố nó dưới dạng mã nguồn mở, để các nhà giao dịch có thể xem xét và xác minh chức năng. Chúc mừng tác giả! Mặc dù bạn có thể sử dụng miễn phí, hãy nhớ rằng việc công bố lại mã phải tuân theo Nội quy.

Thông báo miễn trừ trách nhiệm
Thông tin và các ấn phẩm này không nhằm mục đích, và không cấu thành, lời khuyên hoặc khuyến nghị về tài chính, đầu tư, giao dịch hay các loại khác do TradingView cung cấp hoặc xác nhận. Đọc thêm tại Điều khoản Sử dụng.
Mã nguồn mở
Theo đúng tinh thần TradingView, tác giả của tập lệnh này đã công bố nó dưới dạng mã nguồn mở, để các nhà giao dịch có thể xem xét và xác minh chức năng. Chúc mừng tác giả! Mặc dù bạn có thể sử dụng miễn phí, hãy nhớ rằng việc công bố lại mã phải tuân theo Nội quy.
Thông báo miễn trừ trách nhiệm
Thông tin và các ấn phẩm này không nhằm mục đích, và không cấu thành, lời khuyên hoặc khuyến nghị về tài chính, đầu tư, giao dịch hay các loại khác do TradingView cung cấp hoặc xác nhận. Đọc thêm tại Điều khoản Sử dụng.