Cập nhật
NY RTH Opening Range [M1D]
NY RTH Opening Range [M1D]
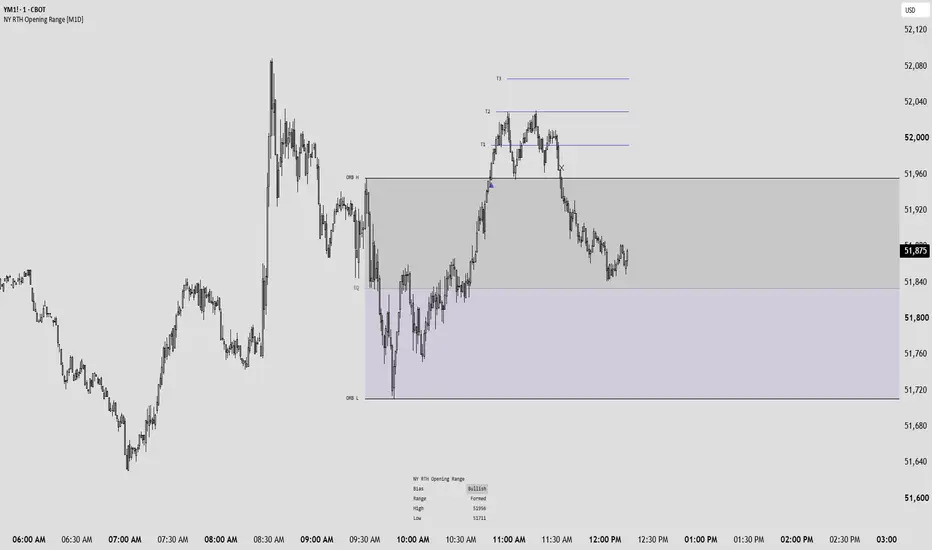
This indicator marks the New York Regular Trading Hours Opening Range (09:30–10:00 New York time, DST-adjusted automatically) on any chart timeframe at or below 30 minutes.
How it works: the script accumulates the highest high and lowest low across every bar that falls inside the 09:30–10:00 New York session window, rather than assuming a single candle equals the range — this makes it accurate whether you're viewing a 1-minute or 30-minute chart.
Once the window closes, the range locks and three levels are drawn: the range high, the range low, and the midpoint (equilibrium). The current day's range plus a user-defined number of prior days are displayed for reference, with prior days dimmed automatically.
After the range locks, the script monitors price for a confirmed bar close beyond the range high or low and marks a single directional signal per side per day. If price later closes back inside the range following a break, a separate marker flags that the break may have failed, prompting reassessment rather than continued directional bias.
A status panel in the corner of the chart shows whether the range is still forming or has locked, the current high/low values, and the live directional bias.
Settings: session window and timezone, line extension length, number of prior days shown, line/marker colours, and panel visibility are all user-adjustable via the indicator's settings menu.
Note: This tool identifies a structural reference level and does not constitute financial advice or a standalone trading signal. As with any single concept, it is intended to be used as one component of a broader trading framework and should be combined with proper risk management.
This indicator marks the New York Regular Trading Hours Opening Range (09:30–10:00 New York time, DST-adjusted automatically) on any chart timeframe at or below 30 minutes.
How it works: the script accumulates the highest high and lowest low across every bar that falls inside the 09:30–10:00 New York session window, rather than assuming a single candle equals the range — this makes it accurate whether you're viewing a 1-minute or 30-minute chart.
Once the window closes, the range locks and three levels are drawn: the range high, the range low, and the midpoint (equilibrium). The current day's range plus a user-defined number of prior days are displayed for reference, with prior days dimmed automatically.
After the range locks, the script monitors price for a confirmed bar close beyond the range high or low and marks a single directional signal per side per day. If price later closes back inside the range following a break, a separate marker flags that the break may have failed, prompting reassessment rather than continued directional bias.
A status panel in the corner of the chart shows whether the range is still forming or has locked, the current high/low values, and the live directional bias.
Settings: session window and timezone, line extension length, number of prior days shown, line/marker colours, and panel visibility are all user-adjustable via the indicator's settings menu.
Note: This tool identifies a structural reference level and does not constitute financial advice or a standalone trading signal. As with any single concept, it is intended to be used as one component of a broader trading framework and should be combined with proper risk management.
Phát hành các Ghi chú
Matches the suiteThe opening range high and low draw solid black at width 1, and the equilibrium dotted grey. Bullish breaks are purple and bearish breaks magenta, the same as every other M1D script.
Names on the level
ORB H, ORB L and EQ sit at the left end of their own line, on its price, clear of where price is heading, instead of floating above or below it.
A two-column table
The status table leads with bias, then whether the range has formed, then its high and low, in black with a title row. It sits bottom centre by default. One text size setting sets the labels and the table.
Targets
After the first close through the range, targets step out in that direction, half a range apart by default. Each one appears when price reaches the one before it, numbered T1, T2 and on at the left end of each line, in purple above the range and magenta below. The step, the count, the line length and the colours are all settings.
Lines stay ahead of price
The range lines and targets end at 16:55 New York by default, a setting. Until then they reach at least one candle past the live candle, on any timeframe.
Premium and discount fill
One option shades the top half of the range red as premium and the bottom half blue as discount. Off by default; both colours are settings.
Reset the indicator to its defaults once so saved colours line up.
Phát hành các Ghi chú
Clean look: bearish is dark grey (was magenta). The premium half is dark grey, the discount half violet, and EQ is dark grey.The status table is borderless, with the bias on a grey pill.
Range logic unchanged.

Thông báo miễn trừ trách nhiệm
Thông tin và các ấn phẩm này không nhằm mục đích, và không cấu thành, lời khuyên hoặc khuyến nghị về tài chính, đầu tư, giao dịch hay các loại khác do TradingView cung cấp hoặc xác nhận. Đọc thêm tại Điều khoản Sử dụng.
Thông báo miễn trừ trách nhiệm
Thông tin và các ấn phẩm này không nhằm mục đích, và không cấu thành, lời khuyên hoặc khuyến nghị về tài chính, đầu tư, giao dịch hay các loại khác do TradingView cung cấp hoặc xác nhận. Đọc thêm tại Điều khoản Sử dụng.