OPEN-SOURCE SCRIPT
Cập nhật Multiple MA Dashboard [PUCHON]
📊 Multiple MA Dashboard [PUCHON]
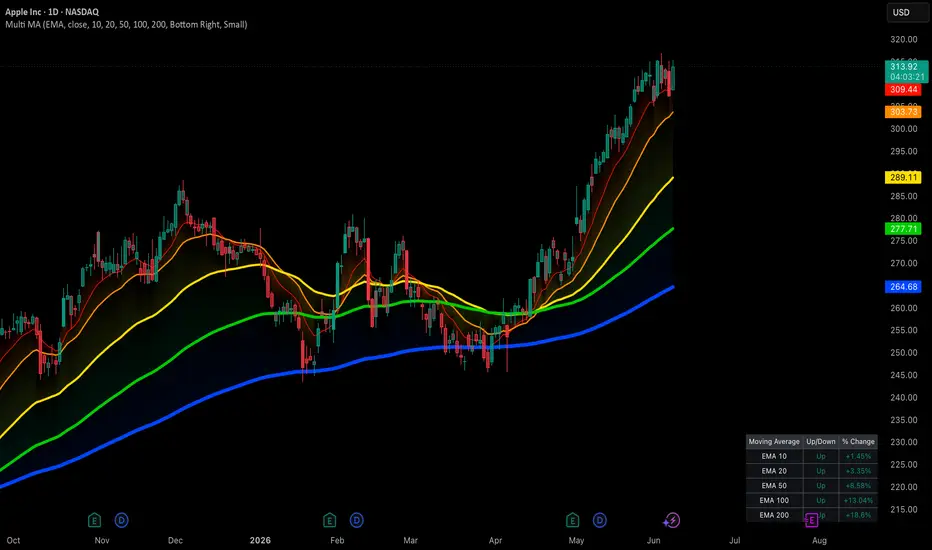
The Multiple MA Dashboard plots up to 5 moving averages of a chosen type (EMA, SMA, WMA, or RMA) directly on your chart and summarizes their relationship to price in a clean, real-time table. Instead of eyeballing where price sits relative to each average, this indicator gives you an instant Up/Down read and the exact percentage distance for every MA.
✨ Features:
- 📈 5 Configurable Moving Averages: Set independent lengths (defaults: 10, 20, 50, 100, 200) sharing one MA type and source.
- 🔁 Switchable MA Type: Choose between EMA, SMA, WMA, and RMA from a single dropdown — all 5 lines update together.
- 📋 Live Dashboard Table: Displays each MA's label, trend direction (Up/Down), and percentage distance from price, refreshed on the latest bar.
- 🎨 Dynamic Trend Coloring: Lines, fills, and table text automatically switch between your chosen "Up" and "Down" colors based on whether price is above or below each MA.
- 🌈 Price-to-MA Fill Zones: Shaded regions between price and each MA make the gap easy to see at a glance.
- ⚙️ Fully Customizable: Adjust MA lengths, source, dashboard position, text size, and theme colors to fit your setup.
🧮 Calculation Logic:
The core getMa function selects the moving average algorithm based on the user's choice, while each MA's color and table row are derived from a simple comparison between price and that MA.
Pine Script®
💡 Interpretation:
- 🟢 Up (price > MA): Price is trading above the average — shown in your "Up Trend" color with a positive % distance.
- 🔴 Down (price < MA): Price is trading below the average — shown in your "Down Trend" color with a negative % distance.
- 📏 % Change: The percentage gap between price and each MA, useful for gauging how stretched or compressed price is relative to that average.
⚠️ Disclaimer:
This tool is provided for educational and informational purposes only. It does not constitute financial advice and does not guarantee future performance. Always combine it with your own analysis and proper risk management.
The Multiple MA Dashboard plots up to 5 moving averages of a chosen type (EMA, SMA, WMA, or RMA) directly on your chart and summarizes their relationship to price in a clean, real-time table. Instead of eyeballing where price sits relative to each average, this indicator gives you an instant Up/Down read and the exact percentage distance for every MA.
✨ Features:
- 📈 5 Configurable Moving Averages: Set independent lengths (defaults: 10, 20, 50, 100, 200) sharing one MA type and source.
- 🔁 Switchable MA Type: Choose between EMA, SMA, WMA, and RMA from a single dropdown — all 5 lines update together.
- 📋 Live Dashboard Table: Displays each MA's label, trend direction (Up/Down), and percentage distance from price, refreshed on the latest bar.
- 🎨 Dynamic Trend Coloring: Lines, fills, and table text automatically switch between your chosen "Up" and "Down" colors based on whether price is above or below each MA.
- 🌈 Price-to-MA Fill Zones: Shaded regions between price and each MA make the gap easy to see at a glance.
- ⚙️ Fully Customizable: Adjust MA lengths, source, dashboard position, text size, and theme colors to fit your setup.
🧮 Calculation Logic:
The core getMa function selects the moving average algorithm based on the user's choice, while each MA's color and table row are derived from a simple comparison between price and that MA.
💡 Interpretation:
- 🟢 Up (price > MA): Price is trading above the average — shown in your "Up Trend" color with a positive % distance.
- 🔴 Down (price < MA): Price is trading below the average — shown in your "Down Trend" color with a negative % distance.
- 📏 % Change: The percentage gap between price and each MA, useful for gauging how stretched or compressed price is relative to that average.
⚠️ Disclaimer:
This tool is provided for educational and informational purposes only. It does not constitute financial advice and does not guarantee future performance. Always combine it with your own analysis and proper risk management.
Phát hành các Ghi chú
Updated: Able to adjust color on MAPhát hành các Ghi chú
Fixed: NameMã nguồn mở
Theo đúng tinh thần TradingView, tác giả của tập lệnh này đã công bố nó dưới dạng mã nguồn mở, để các nhà giao dịch có thể xem xét và xác minh chức năng. Chúc mừng tác giả! Mặc dù bạn có thể sử dụng miễn phí, hãy nhớ rằng việc công bố lại mã phải tuân theo Nội quy.

Thông báo miễn trừ trách nhiệm
Thông tin và các ấn phẩm này không nhằm mục đích, và không cấu thành, lời khuyên hoặc khuyến nghị về tài chính, đầu tư, giao dịch hay các loại khác do TradingView cung cấp hoặc xác nhận. Đọc thêm tại Điều khoản Sử dụng.
Mã nguồn mở
Theo đúng tinh thần TradingView, tác giả của tập lệnh này đã công bố nó dưới dạng mã nguồn mở, để các nhà giao dịch có thể xem xét và xác minh chức năng. Chúc mừng tác giả! Mặc dù bạn có thể sử dụng miễn phí, hãy nhớ rằng việc công bố lại mã phải tuân theo Nội quy.
Thông báo miễn trừ trách nhiệm
Thông tin và các ấn phẩm này không nhằm mục đích, và không cấu thành, lời khuyên hoặc khuyến nghị về tài chính, đầu tư, giao dịch hay các loại khác do TradingView cung cấp hoặc xác nhận. Đọc thêm tại Điều khoản Sử dụng.