OPEN-SOURCE SCRIPT
RichmondHillCM - VWAP & Volume-Spike Suite V1.3
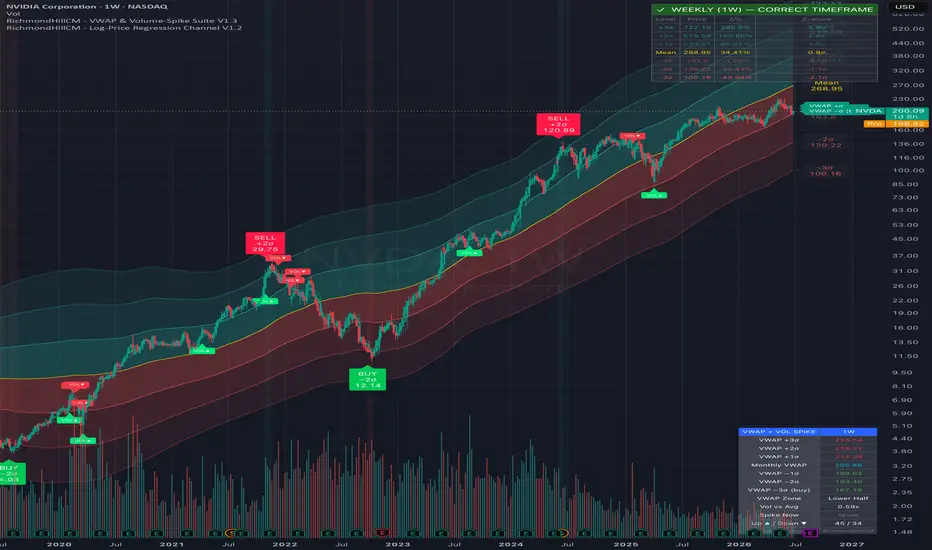
RichmondHillCM — VWAP & Volume-Spike Suite
A clean, focused overlay that combines an anchored monthly VWAP with above-average volume detection to flag high-conviction bars in real time. Built for the weekly chart but works on any timeframe.
What it does
The indicator watches for volume spikes — bars where volume rises above its own moving average by a set threshold — and marks each one with a directional triangle:
Green up-triangle (below the bar) — a volume spike closing on the bullish side (buyers in control)
Red down-triangle (above the bar) — a volume spike closing on the bearish side (sellers in control)
"Bullish" and "bearish" are, by default, defined relative to the monthly VWAP: a spike closing above VWAP prints an up-triangle; below VWAP prints a down-triangle. This ties conviction (volume) to fair value (VWAP) in a single, easy-to-read signal.
The VWAP structure
An anchored VWAP resets at the start of each month and acts as the volume-weighted "fair value" pivot. Standard-deviation bands bracket the typical range around it:
Lower bands (−1σ / −2σ / −3σ) — progressively cheap vs fair value; classic long / entry zones
Upper bands (+1σ / +2σ / +3σ) — progressively rich vs fair value; scale-out / short zones
VWAP itself — the mean pivot: reclaim = bullish, lose = bearish
A live summary table lists all seven VWAP levels (±1σ, ±2σ, ±3σ and the mean), the current VWAP zone, the latest volume-vs-average ratio, the live spike state, and a running count of bullish vs bearish spikes. On a weekly chart each month spans roughly 4–5 bars, giving the VWAP and its bands enough data to be meaningful.
Settings
Volume MA length and spike threshold (× average)
Direction definition: VWAP-relative (default), Candle (close vs open), or Close-to-Close
Band width (σ multiplier) for the plotted band, plus toggles for bands, shading, and on-chart labels
Optional "confirm on bar close" to avoid intrabar repaint on the live bar
Summary table with a Top / Bottom position toggle
Built-in alerts for bullish/bearish spikes and VWAP reclaim/loss
How to use it
Watch for a lower-band tag paired with a bullish spike triangle as a potential long, and an upper-band tag paired with a bearish spike triangle as a scale-out or short. Use the VWAP itself as your mean pivot — trading above it favors longs, below it favors shorts.
For educational and informational purposes only; not financial advice. Always do your own research and manage risk.
A clean, focused overlay that combines an anchored monthly VWAP with above-average volume detection to flag high-conviction bars in real time. Built for the weekly chart but works on any timeframe.
What it does
The indicator watches for volume spikes — bars where volume rises above its own moving average by a set threshold — and marks each one with a directional triangle:
Green up-triangle (below the bar) — a volume spike closing on the bullish side (buyers in control)
Red down-triangle (above the bar) — a volume spike closing on the bearish side (sellers in control)
"Bullish" and "bearish" are, by default, defined relative to the monthly VWAP: a spike closing above VWAP prints an up-triangle; below VWAP prints a down-triangle. This ties conviction (volume) to fair value (VWAP) in a single, easy-to-read signal.
The VWAP structure
An anchored VWAP resets at the start of each month and acts as the volume-weighted "fair value" pivot. Standard-deviation bands bracket the typical range around it:
Lower bands (−1σ / −2σ / −3σ) — progressively cheap vs fair value; classic long / entry zones
Upper bands (+1σ / +2σ / +3σ) — progressively rich vs fair value; scale-out / short zones
VWAP itself — the mean pivot: reclaim = bullish, lose = bearish
A live summary table lists all seven VWAP levels (±1σ, ±2σ, ±3σ and the mean), the current VWAP zone, the latest volume-vs-average ratio, the live spike state, and a running count of bullish vs bearish spikes. On a weekly chart each month spans roughly 4–5 bars, giving the VWAP and its bands enough data to be meaningful.
Settings
Volume MA length and spike threshold (× average)
Direction definition: VWAP-relative (default), Candle (close vs open), or Close-to-Close
Band width (σ multiplier) for the plotted band, plus toggles for bands, shading, and on-chart labels
Optional "confirm on bar close" to avoid intrabar repaint on the live bar
Summary table with a Top / Bottom position toggle
Built-in alerts for bullish/bearish spikes and VWAP reclaim/loss
How to use it
Watch for a lower-band tag paired with a bullish spike triangle as a potential long, and an upper-band tag paired with a bearish spike triangle as a scale-out or short. Use the VWAP itself as your mean pivot — trading above it favors longs, below it favors shorts.
For educational and informational purposes only; not financial advice. Always do your own research and manage risk.
Mã nguồn mở
Theo đúng tinh thần TradingView, tác giả của tập lệnh này đã công bố nó dưới dạng mã nguồn mở, để các nhà giao dịch có thể xem xét và xác minh chức năng. Chúc mừng tác giả! Mặc dù bạn có thể sử dụng miễn phí, hãy nhớ rằng việc công bố lại mã phải tuân theo Nội quy.

Thông báo miễn trừ trách nhiệm
Thông tin và các ấn phẩm này không nhằm mục đích, và không cấu thành, lời khuyên hoặc khuyến nghị về tài chính, đầu tư, giao dịch hay các loại khác do TradingView cung cấp hoặc xác nhận. Đọc thêm tại Điều khoản Sử dụng.
Mã nguồn mở
Theo đúng tinh thần TradingView, tác giả của tập lệnh này đã công bố nó dưới dạng mã nguồn mở, để các nhà giao dịch có thể xem xét và xác minh chức năng. Chúc mừng tác giả! Mặc dù bạn có thể sử dụng miễn phí, hãy nhớ rằng việc công bố lại mã phải tuân theo Nội quy.
Thông báo miễn trừ trách nhiệm
Thông tin và các ấn phẩm này không nhằm mục đích, và không cấu thành, lời khuyên hoặc khuyến nghị về tài chính, đầu tư, giao dịch hay các loại khác do TradingView cung cấp hoặc xác nhận. Đọc thêm tại Điều khoản Sử dụng.