Active Move Counter (Points/Ticks) + Avg Candle (Ticks)
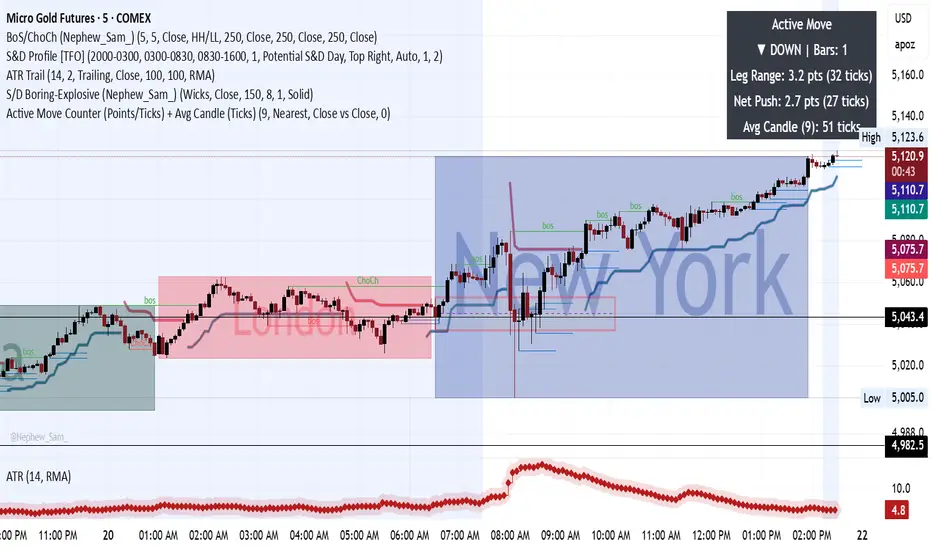
What This Indicator Is Measuring (Plain English)
It measures how strong the CURRENT price move is while it is happening.
Think of it like a speedometer for price movement.
Instead of guessing:
“Is this move still alive?”
You now see how far price has actually traveled in the current leg.
The 4 Numbers You See (What Each Means)
Your table shows:
1️⃣ Direction (UP ▲ / DOWN ▼)
Example:
Copy code
▲ UP | Bars: 6
Meaning:
Market has been moving upward
Current push has lasted 6 candles
Why this matters
Trends don’t start strong immediately.
You now see whether you are:
early in move
middle of move
late in move
2️⃣ Leg Range (MOST IMPORTANT)
Example:
Copy code
Leg Range: 42 pts (420 ticks)
This means:
From the start of this move until now, price has traveled 42 points total.
This is the true size of the current move.
How YOU use this (gold specific)
You already discovered:
Gold expansions often run 40–120 points
So now you compare:
Leg Range
Meaning
10–20 pts
move just starting
30–50 pts
healthy continuation
70–100+ pts
move becoming mature
120+ pts
exhaustion risk
You are no longer guessing if a move is extended.
You can SEE it.
3️⃣ Net Push (Your Secret Weapon)
Example:
Copy code
Net Push: 18 pts
This tells you:
How far price currently sits from the opposite extreme of the move.
This measures ACTIVE momentum right now.
Difference Between Leg Range vs Net Push
Leg Range
How big the whole move has been.
Net Push
How strong price is right now.
Example (VERY IMPORTANT)
Healthy Trend
Copy code
Leg Range: 60 pts
Net Push: 50 pts
➡ Buyers still control price.
Pullbacks are shallow.
Continuation likely.
Weakening Trend
Copy code
Leg Range: 60 pts
Net Push: 12 pts
➡ Price traveled far but lost momentum.
This is where reversals begin.
It measures how strong the CURRENT price move is while it is happening.
Think of it like a speedometer for price movement.
Instead of guessing:
“Is this move still alive?”
You now see how far price has actually traveled in the current leg.
The 4 Numbers You See (What Each Means)
Your table shows:
1️⃣ Direction (UP ▲ / DOWN ▼)
Example:
Copy code
▲ UP | Bars: 6
Meaning:
Market has been moving upward
Current push has lasted 6 candles
Why this matters
Trends don’t start strong immediately.
You now see whether you are:
early in move
middle of move
late in move
2️⃣ Leg Range (MOST IMPORTANT)
Example:
Copy code
Leg Range: 42 pts (420 ticks)
This means:
From the start of this move until now, price has traveled 42 points total.
This is the true size of the current move.
How YOU use this (gold specific)
You already discovered:
Gold expansions often run 40–120 points
So now you compare:
Leg Range
Meaning
10–20 pts
move just starting
30–50 pts
healthy continuation
70–100+ pts
move becoming mature
120+ pts
exhaustion risk
You are no longer guessing if a move is extended.
You can SEE it.
3️⃣ Net Push (Your Secret Weapon)
Example:
Copy code
Net Push: 18 pts
This tells you:
How far price currently sits from the opposite extreme of the move.
This measures ACTIVE momentum right now.
Difference Between Leg Range vs Net Push
Leg Range
How big the whole move has been.
Net Push
How strong price is right now.
Example (VERY IMPORTANT)
Healthy Trend
Copy code
Leg Range: 60 pts
Net Push: 50 pts
➡ Buyers still control price.
Pullbacks are shallow.
Continuation likely.
Weakening Trend
Copy code
Leg Range: 60 pts
Net Push: 12 pts
➡ Price traveled far but lost momentum.
This is where reversals begin.

Thông báo miễn trừ trách nhiệm
Thông tin và các ấn phẩm này không nhằm mục đích, và không cấu thành, lời khuyên hoặc khuyến nghị về tài chính, đầu tư, giao dịch hay các loại khác do TradingView cung cấp hoặc xác nhận. Đọc thêm tại Điều khoản Sử dụng.
Thông báo miễn trừ trách nhiệm
Thông tin và các ấn phẩm này không nhằm mục đích, và không cấu thành, lời khuyên hoặc khuyến nghị về tài chính, đầu tư, giao dịch hay các loại khác do TradingView cung cấp hoặc xác nhận. Đọc thêm tại Điều khoản Sử dụng.