KAMA H
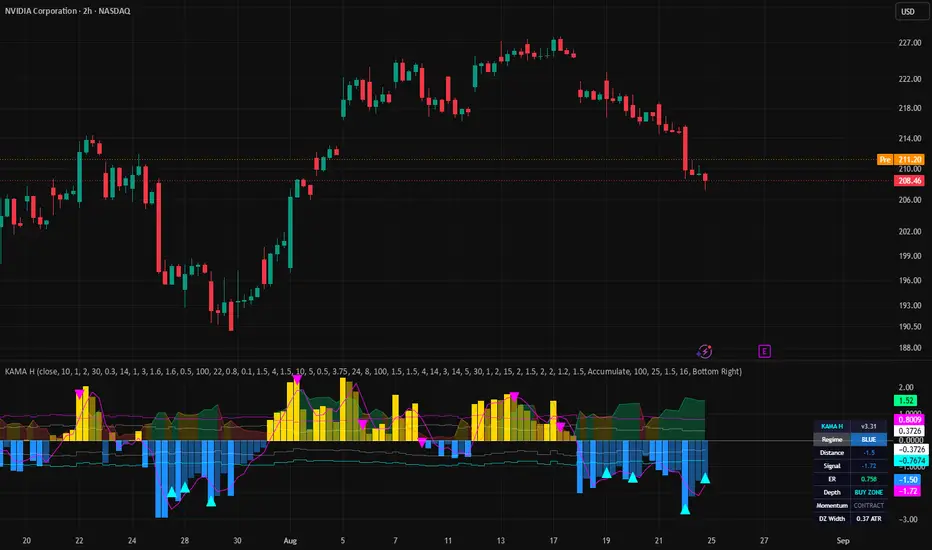
KAMA H is the companion pane for KAMA Regime. It carries the identical decision logic as the overlay version and re-draws it as an oscillator, so you can see what the engine sees: how far price has stretched from its adaptive anchor, and exactly where the signal thresholds sit.
The main histogram is the distance between price and the adaptive average, measured in units of typical bar range: gold above the line, blue below, brighter while the stretch is expanding and dimmer while it contracts. A smoothed signal line rides on top. Dotted lines mark the dead zone and the two learned stretch bands in the same distance units, so a signal is always visible as the histogram reaching a line. An efficiency shading along the bottom shows when the tape is traveling cleanly versus chopping, and a small status card summarizes the current regime, distance, efficiency, band position, and momentum at a glance.
To use it as intended, load it in a pane beneath KAMA Regime with both left at default settings; the triangles in the pane will line up bar for bar with the markers on the price chart. If you change a setting on one, make the same change on the other and they stay in step. On its own, the pane also works as a general stretched-or-not oscillator for any symbol.
All the overlay's optional filters are present here with the same defaults, and every internal reading is exported to the data window for anyone who wants to study the components. Background regime tinting is available in settings and ships off.
Research and educational use only; not financial advice. No prediction is made or implied.
The main histogram is the distance between price and the adaptive average, measured in units of typical bar range: gold above the line, blue below, brighter while the stretch is expanding and dimmer while it contracts. A smoothed signal line rides on top. Dotted lines mark the dead zone and the two learned stretch bands in the same distance units, so a signal is always visible as the histogram reaching a line. An efficiency shading along the bottom shows when the tape is traveling cleanly versus chopping, and a small status card summarizes the current regime, distance, efficiency, band position, and momentum at a glance.
To use it as intended, load it in a pane beneath KAMA Regime with both left at default settings; the triangles in the pane will line up bar for bar with the markers on the price chart. If you change a setting on one, make the same change on the other and they stay in step. On its own, the pane also works as a general stretched-or-not oscillator for any symbol.
All the overlay's optional filters are present here with the same defaults, and every internal reading is exported to the data window for anyone who wants to study the components. Background regime tinting is available in settings and ships off.
Research and educational use only; not financial advice. No prediction is made or implied.

Thông báo miễn trừ trách nhiệm
Thông tin và các ấn phẩm này không nhằm mục đích, và không cấu thành, lời khuyên hoặc khuyến nghị về tài chính, đầu tư, giao dịch hay các loại khác do TradingView cung cấp hoặc xác nhận. Đọc thêm tại Điều khoản Sử dụng.
Thông báo miễn trừ trách nhiệm
Thông tin và các ấn phẩm này không nhằm mục đích, và không cấu thành, lời khuyên hoặc khuyến nghị về tài chính, đầu tư, giao dịch hay các loại khác do TradingView cung cấp hoặc xác nhận. Đọc thêm tại Điều khoản Sử dụng.