OPEN-SOURCE SCRIPT
Combined Market Breadth Table
Overview
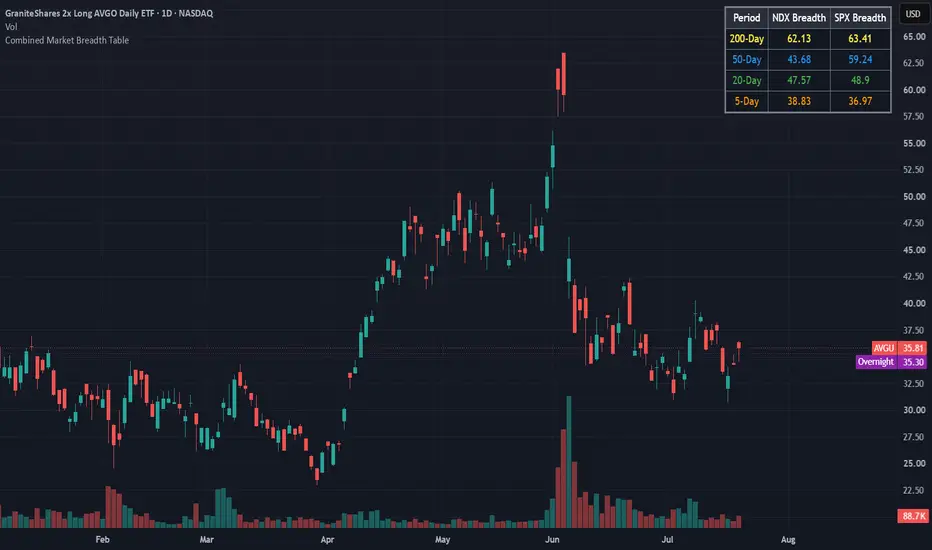
Combined Market Breadth Table is an overlay indicator that brings key market breadth data directly onto your chart in a clean, compact visual display. It tracks the percentage of stocks trading above major moving averages across two of the most heavily watched benchmarks: the Nasdaq 100 (NDX) and the S&P 500 (SPX).
Instead of clogging your screen with multiple lower-pane indicators, this script compiles short-term, medium-term, and long-term breadth metrics into a single table anchored to the top-right corner of your chart.
Key Features
Multi-Timeframe Moving Average Tracking: Displays the percentage of stocks trading above their 200-day, 50-day, 20-day, and 5-day moving averages simultaneously.
Dual-Index Comparison: Tracks both the Nasdaq 100 (NDX) and S&P 500 (SPX) side-by-side to easily spot divergence between tech heavyweights and the broader market.
Color-Coded Rows: Each moving average timeframe uses a distinct, color-coded text palette for quick scanning:
🟡 200-Day (Yellow): Macro / long-term structural trend.
🔵 50-Day (Blue): Intermediate trend.
🟢 20-Day (Green): Short-term trend.
🟠 5-Day (Orange): Ultra-short-term / momentum pulse.
Non-Intrusive Design: Renders only on the latest bar inside a dark, framed table box in the top-right corner, leaving your price action uncluttered.
Combined Market Breadth Table is an overlay indicator that brings key market breadth data directly onto your chart in a clean, compact visual display. It tracks the percentage of stocks trading above major moving averages across two of the most heavily watched benchmarks: the Nasdaq 100 (NDX) and the S&P 500 (SPX).
Instead of clogging your screen with multiple lower-pane indicators, this script compiles short-term, medium-term, and long-term breadth metrics into a single table anchored to the top-right corner of your chart.
Key Features
Multi-Timeframe Moving Average Tracking: Displays the percentage of stocks trading above their 200-day, 50-day, 20-day, and 5-day moving averages simultaneously.
Dual-Index Comparison: Tracks both the Nasdaq 100 (NDX) and S&P 500 (SPX) side-by-side to easily spot divergence between tech heavyweights and the broader market.
Color-Coded Rows: Each moving average timeframe uses a distinct, color-coded text palette for quick scanning:
🟡 200-Day (Yellow): Macro / long-term structural trend.
🔵 50-Day (Blue): Intermediate trend.
🟢 20-Day (Green): Short-term trend.
🟠 5-Day (Orange): Ultra-short-term / momentum pulse.
Non-Intrusive Design: Renders only on the latest bar inside a dark, framed table box in the top-right corner, leaving your price action uncluttered.
Mã nguồn mở
Theo đúng tinh thần TradingView, tác giả của tập lệnh này đã công bố nó dưới dạng mã nguồn mở, để các nhà giao dịch có thể xem xét và xác minh chức năng. Chúc mừng tác giả! Mặc dù bạn có thể sử dụng miễn phí, hãy nhớ rằng việc công bố lại mã phải tuân theo Nội quy.

Thông báo miễn trừ trách nhiệm
Thông tin và các ấn phẩm này không nhằm mục đích, và không cấu thành, lời khuyên hoặc khuyến nghị về tài chính, đầu tư, giao dịch hay các loại khác do TradingView cung cấp hoặc xác nhận. Đọc thêm tại Điều khoản Sử dụng.
Mã nguồn mở
Theo đúng tinh thần TradingView, tác giả của tập lệnh này đã công bố nó dưới dạng mã nguồn mở, để các nhà giao dịch có thể xem xét và xác minh chức năng. Chúc mừng tác giả! Mặc dù bạn có thể sử dụng miễn phí, hãy nhớ rằng việc công bố lại mã phải tuân theo Nội quy.
Thông báo miễn trừ trách nhiệm
Thông tin và các ấn phẩm này không nhằm mục đích, và không cấu thành, lời khuyên hoặc khuyến nghị về tài chính, đầu tư, giao dịch hay các loại khác do TradingView cung cấp hoặc xác nhận. Đọc thêm tại Điều khoản Sử dụng.