OPEN-SOURCE SCRIPT
OB + 2G2R + EMA/BB/ST/VWAP + Doji + Day Levels
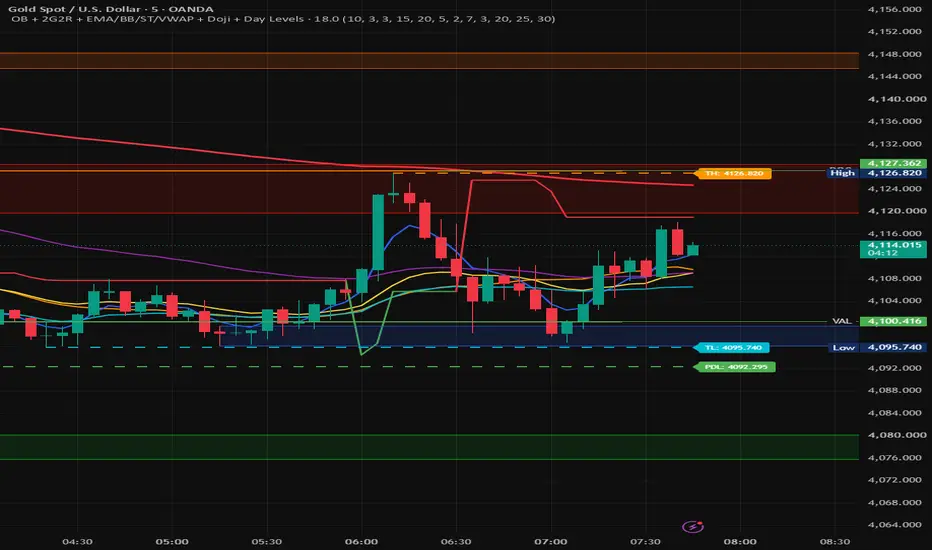
It is a multi-signal chart indicator. It does not place trades automatically; it plots trend tools, levels, and buy/sell markers.
It shows:
BB Mid — the 20-period SMA, used as the crossover reference.
EMA 5, EMA 20, EMA 50, EMA 200 — trend direction filters.
SuperTrend — green when bullish and red when bearish.
Today’s High and Today’s Low — running intraday high/low levels, updated as new candles form.
EMA BUY — EMA 5 crosses above BB Mid, the candle is bullish, and price is above EMA 20/50/200.
EMA SELL — EMA 5 crosses below BB Mid, the candle is bearish, and price is below EMA 20/50/200.
ST BUY / ST SELL — SuperTrend direction changes and the current candle breaks the previous candle’s high or low.
2R2G BUY — two bearish candles followed by two bullish candles.
2G2R SELL — two bullish candles followed by two bearish candles.
Doji Buy / Sell setups — a bullish-to-bearish or bearish-to-bullish two-candle sequence followed by a small-body doji.
The signals are independent. For example, a 2R2G marker does not require an EMA crossover or SuperTrend confirmation. The strongest practical use is to treat EMA trend, SuperTrend direction, and the candle pattern as confirmation together rather than entering on every marker.
It shows:
BB Mid — the 20-period SMA, used as the crossover reference.
EMA 5, EMA 20, EMA 50, EMA 200 — trend direction filters.
SuperTrend — green when bullish and red when bearish.
Today’s High and Today’s Low — running intraday high/low levels, updated as new candles form.
EMA BUY — EMA 5 crosses above BB Mid, the candle is bullish, and price is above EMA 20/50/200.
EMA SELL — EMA 5 crosses below BB Mid, the candle is bearish, and price is below EMA 20/50/200.
ST BUY / ST SELL — SuperTrend direction changes and the current candle breaks the previous candle’s high or low.
2R2G BUY — two bearish candles followed by two bullish candles.
2G2R SELL — two bullish candles followed by two bearish candles.
Doji Buy / Sell setups — a bullish-to-bearish or bearish-to-bullish two-candle sequence followed by a small-body doji.
The signals are independent. For example, a 2R2G marker does not require an EMA crossover or SuperTrend confirmation. The strongest practical use is to treat EMA trend, SuperTrend direction, and the candle pattern as confirmation together rather than entering on every marker.
Mã nguồn mở
Theo đúng tinh thần TradingView, tác giả của tập lệnh này đã công bố nó dưới dạng mã nguồn mở, để các nhà giao dịch có thể xem xét và xác minh chức năng. Chúc mừng tác giả! Mặc dù bạn có thể sử dụng miễn phí, hãy nhớ rằng việc công bố lại mã phải tuân theo Nội quy.

Thông báo miễn trừ trách nhiệm
Thông tin và các ấn phẩm này không nhằm mục đích, và không cấu thành, lời khuyên hoặc khuyến nghị về tài chính, đầu tư, giao dịch hay các loại khác do TradingView cung cấp hoặc xác nhận. Đọc thêm tại Điều khoản Sử dụng.
Mã nguồn mở
Theo đúng tinh thần TradingView, tác giả của tập lệnh này đã công bố nó dưới dạng mã nguồn mở, để các nhà giao dịch có thể xem xét và xác minh chức năng. Chúc mừng tác giả! Mặc dù bạn có thể sử dụng miễn phí, hãy nhớ rằng việc công bố lại mã phải tuân theo Nội quy.
Thông báo miễn trừ trách nhiệm
Thông tin và các ấn phẩm này không nhằm mục đích, và không cấu thành, lời khuyên hoặc khuyến nghị về tài chính, đầu tư, giao dịch hay các loại khác do TradingView cung cấp hoặc xác nhận. Đọc thêm tại Điều khoản Sử dụng.