OPEN-SOURCE SCRIPT
Alpha-Stable Stability Index [LB]
Concept
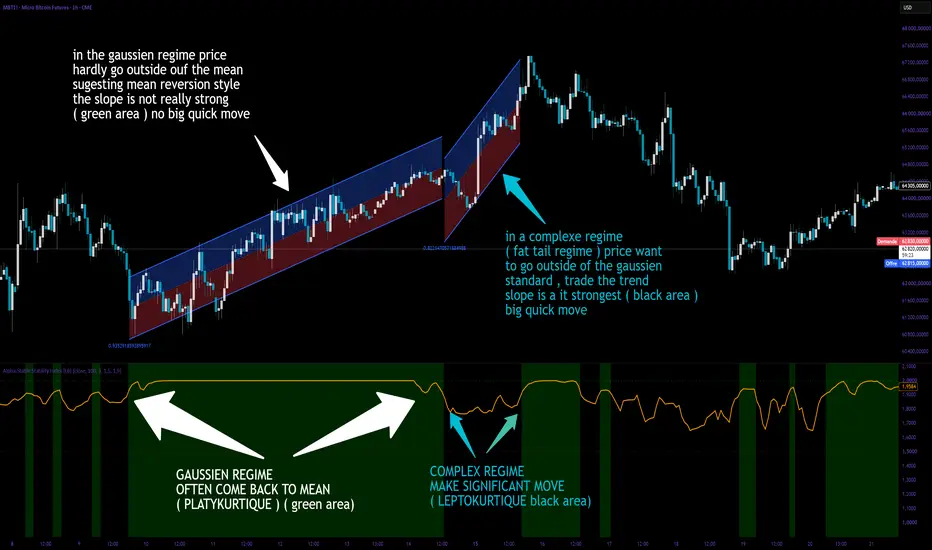
The Alpha-Stable Stability Index estimates the tail index alpha of an alpha-stable distribution using McCulloch's quantile method (1986). Alpha ranges from 0 (extremely heavy-tailed, infinite variance) to 2 (Gaussian, finite variance). The indicator quantifies how prone the market is to wild, outsized moves and visually separates the chart into three regimes : Gaussian (green), transitional (black/default background), and heavy-tailed (red).
Mathematical Foundation
The estimation follows McCulloch (1986), "Simple Consistent Estimators of Stable Distribution Parameters". It relies on sample quantiles, which are robust and computationally light.
Given a window of N log-returns sorted in ascending order, four quantiles are extracted :
q05 = 5th percentile
q25 = 25th percentile
q75 = 75th percentile
q95 = 95th percentile
The tail-to-body ratio nu is computed as :
nu = (q95 - q05) / (q75 - q25)
For a Gaussian distribution, nu is approximately 2.0. For heavy-tailed stable distributions, nu increases beyond 3.0. The indicator maps nu to alpha using a calibrated rational approximation of McCulloch's Table I :
alpha = 2.0 - 0.70 * ln(nu - 1.9) - 0.04 * (ln(nu - 1.9))^2
The result is clamped to [0.3, 2.0] and optionally smoothed with an EMA. The indicator pane displays three distinct visual zones :
- Green background : alpha >= Gaussian Threshold (default 1.9). The distribution is near-Gaussian (mesokurtic). Returns are well-behaved, standard risk management applies.
- Black/default background : alpha between the two thresholds. Transitional regime — neither fully stable nor clearly heavy-tailed.
- Red background : alpha <= Heavy Tail Threshold (default 1.5). The distribution is leptokurtic. Fat tails dominate, extreme events are structurally more frequent.
A brief glossary for interpretation :
Leptokurtic — positive excess kurtosis ; the distribution has fatter tails and a sharper peak than the Gaussian. Alpha < 2.0 indicates leptokurtosis. Price action alternates between long quiet periods and sudden violent bursts.
Platykurtic — negative excess kurtosis ; thinner tails and a flatter peak than the Gaussian. Rare in financial returns but can appear in heavily mean-reverting or range-bound markets. Alpha close to 2.0 with low overall volatility may suggest platykurtic behavior.
Mesokurtic — kurtosis equal to that of the Gaussian (excess kurtosis = 0). Alpha = 2.0 corresponds to this regime. The green background signals this state.
What Problem Does It Solve ?
Classic volatility measures (standard deviation, ATR, historical vol) assume finite second moments and treat all deviations as coming from the same distribution. When the true return distribution is alpha-stable with alpha < 2, the variance is infinite and standard deviation becomes meaningless. The alpha index directly measures tail heaviness without assuming normality, and the green/black/red background gives an immediate visual cue of the risk regime.

How To Interpret
Alpha in the green zone (>= 1.9) — mesokurtic / near-Gaussian. Returns are well-behaved, standard risk management applies.
Alpha in the black zone (1.5 to 1.9) — transitional. The market is neither fully stable nor fully wild ; monitor for a move into the red zone.
Alpha in the red zone (<= 1.5) — leptokurtic / heavy-tailed. The distribution has undefined or extremely high variance. Large price swings are likely. Consider reducing position size, widening stops, and hedging tail risk.
Alpha declining — the market is transitioning toward instability ; rising tail risk ahead.
Parameters
Source — price data for return calculation (default close).
Window Length — number of bars used to compute the empirical quantiles. Longer windows give more stable estimates but react more slowly.
Smoothing — EMA period applied to the raw alpha estimate to reduce noise.
Heavy Tail Threshold — background turns red when alpha falls below this level (default 1.5).
Gaussian Threshold — background turns green when alpha exceeds this level (default 1.9).
Reference
McCulloch J.H., "Simple Consistent Estimators of Stable Distribution Parameters", Communications in Statistics — Simulation and Computation, Vol. 15, No. 4, pp. 1109-1136, 1986.
The Alpha-Stable Stability Index estimates the tail index alpha of an alpha-stable distribution using McCulloch's quantile method (1986). Alpha ranges from 0 (extremely heavy-tailed, infinite variance) to 2 (Gaussian, finite variance). The indicator quantifies how prone the market is to wild, outsized moves and visually separates the chart into three regimes : Gaussian (green), transitional (black/default background), and heavy-tailed (red).
Mathematical Foundation
The estimation follows McCulloch (1986), "Simple Consistent Estimators of Stable Distribution Parameters". It relies on sample quantiles, which are robust and computationally light.
Given a window of N log-returns sorted in ascending order, four quantiles are extracted :
q05 = 5th percentile
q25 = 25th percentile
q75 = 75th percentile
q95 = 95th percentile
The tail-to-body ratio nu is computed as :
nu = (q95 - q05) / (q75 - q25)
For a Gaussian distribution, nu is approximately 2.0. For heavy-tailed stable distributions, nu increases beyond 3.0. The indicator maps nu to alpha using a calibrated rational approximation of McCulloch's Table I :
alpha = 2.0 - 0.70 * ln(nu - 1.9) - 0.04 * (ln(nu - 1.9))^2
The result is clamped to [0.3, 2.0] and optionally smoothed with an EMA. The indicator pane displays three distinct visual zones :
- Green background : alpha >= Gaussian Threshold (default 1.9). The distribution is near-Gaussian (mesokurtic). Returns are well-behaved, standard risk management applies.
- Black/default background : alpha between the two thresholds. Transitional regime — neither fully stable nor clearly heavy-tailed.
- Red background : alpha <= Heavy Tail Threshold (default 1.5). The distribution is leptokurtic. Fat tails dominate, extreme events are structurally more frequent.
A brief glossary for interpretation :
Leptokurtic — positive excess kurtosis ; the distribution has fatter tails and a sharper peak than the Gaussian. Alpha < 2.0 indicates leptokurtosis. Price action alternates between long quiet periods and sudden violent bursts.
Platykurtic — negative excess kurtosis ; thinner tails and a flatter peak than the Gaussian. Rare in financial returns but can appear in heavily mean-reverting or range-bound markets. Alpha close to 2.0 with low overall volatility may suggest platykurtic behavior.
Mesokurtic — kurtosis equal to that of the Gaussian (excess kurtosis = 0). Alpha = 2.0 corresponds to this regime. The green background signals this state.
What Problem Does It Solve ?
Classic volatility measures (standard deviation, ATR, historical vol) assume finite second moments and treat all deviations as coming from the same distribution. When the true return distribution is alpha-stable with alpha < 2, the variance is infinite and standard deviation becomes meaningless. The alpha index directly measures tail heaviness without assuming normality, and the green/black/red background gives an immediate visual cue of the risk regime.
How To Interpret
Alpha in the green zone (>= 1.9) — mesokurtic / near-Gaussian. Returns are well-behaved, standard risk management applies.
Alpha in the black zone (1.5 to 1.9) — transitional. The market is neither fully stable nor fully wild ; monitor for a move into the red zone.
Alpha in the red zone (<= 1.5) — leptokurtic / heavy-tailed. The distribution has undefined or extremely high variance. Large price swings are likely. Consider reducing position size, widening stops, and hedging tail risk.
Alpha declining — the market is transitioning toward instability ; rising tail risk ahead.
Parameters
Source — price data for return calculation (default close).
Window Length — number of bars used to compute the empirical quantiles. Longer windows give more stable estimates but react more slowly.
Smoothing — EMA period applied to the raw alpha estimate to reduce noise.
Heavy Tail Threshold — background turns red when alpha falls below this level (default 1.5).
Gaussian Threshold — background turns green when alpha exceeds this level (default 1.9).
Reference
McCulloch J.H., "Simple Consistent Estimators of Stable Distribution Parameters", Communications in Statistics — Simulation and Computation, Vol. 15, No. 4, pp. 1109-1136, 1986.
Mã nguồn mở
Theo đúng tinh thần TradingView, tác giả của tập lệnh này đã công bố nó dưới dạng mã nguồn mở, để các nhà giao dịch có thể xem xét và xác minh chức năng. Chúc mừng tác giả! Mặc dù bạn có thể sử dụng miễn phí, hãy nhớ rằng việc công bố lại mã phải tuân theo Nội quy.

Thông báo miễn trừ trách nhiệm
Thông tin và các ấn phẩm này không nhằm mục đích, và không cấu thành, lời khuyên hoặc khuyến nghị về tài chính, đầu tư, giao dịch hay các loại khác do TradingView cung cấp hoặc xác nhận. Đọc thêm tại Điều khoản Sử dụng.
Mã nguồn mở
Theo đúng tinh thần TradingView, tác giả của tập lệnh này đã công bố nó dưới dạng mã nguồn mở, để các nhà giao dịch có thể xem xét và xác minh chức năng. Chúc mừng tác giả! Mặc dù bạn có thể sử dụng miễn phí, hãy nhớ rằng việc công bố lại mã phải tuân theo Nội quy.
Thông báo miễn trừ trách nhiệm
Thông tin và các ấn phẩm này không nhằm mục đích, và không cấu thành, lời khuyên hoặc khuyến nghị về tài chính, đầu tư, giao dịch hay các loại khác do TradingView cung cấp hoặc xác nhận. Đọc thêm tại Điều khoản Sử dụng.