SPY Auction Intelligence v2 - CVD Grid
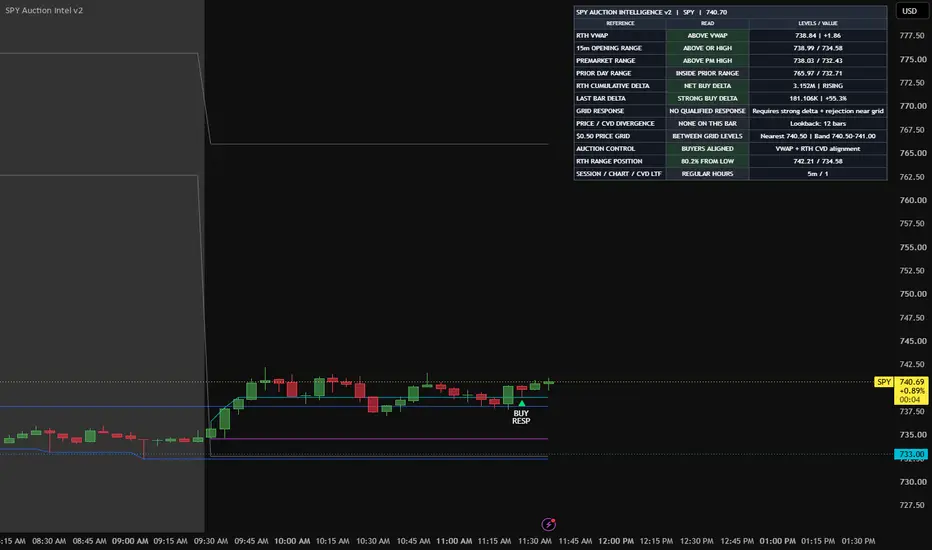
# SPY Auction Intelligence v2 – CVD Grid
A real-time SPY market analysis indicator designed to identify directional opportunities through volume pressure, cumulative volume delta (CVD), and structured $0.50 price levels.
The indicator combines auction-market concepts with price action and volume analysis to help traders evaluate whether SPY is showing bullish or bearish participation at important grid levels.
### Key Features
- **$0.50 Price Grid:** Maps key price intervals to organize intraday support, resistance, and potential reaction zones.
- **Cumulative Volume Delta (CVD):** Tracks estimated buying and selling pressure to help identify directional participation.
- **Grid Reactions:** Highlights potential breakouts, rejections, sweeps, and reclaim patterns around important price levels.
- **Directional Context:** Combines price movement and volume behavior to assess bullish and bearish conditions.
- **Visual Trade Structure:** Helps identify potential entry areas, nearby targets, and levels where a directional thesis may become invalid.
- **Intraday Focus:** Designed for traders analyzing short-term SPY movements and rapidly changing market conditions.
### How to Use
Monitor how SPY behaves around each $0.50 grid level. Look for agreement between price action, CVD direction, and the market's reaction to key levels. Stronger alignment may provide more meaningful directional evidence than any single signal.
**Important:** This indicator is an analytical tool, not an automated trading system or a guarantee of future price movement. CVD calculations may be estimates derived from available chart data and should not be interpreted as definitive exchange-level order flow. Always apply independent risk management.
A real-time SPY market analysis indicator designed to identify directional opportunities through volume pressure, cumulative volume delta (CVD), and structured $0.50 price levels.
The indicator combines auction-market concepts with price action and volume analysis to help traders evaluate whether SPY is showing bullish or bearish participation at important grid levels.
### Key Features
- **$0.50 Price Grid:** Maps key price intervals to organize intraday support, resistance, and potential reaction zones.
- **Cumulative Volume Delta (CVD):** Tracks estimated buying and selling pressure to help identify directional participation.
- **Grid Reactions:** Highlights potential breakouts, rejections, sweeps, and reclaim patterns around important price levels.
- **Directional Context:** Combines price movement and volume behavior to assess bullish and bearish conditions.
- **Visual Trade Structure:** Helps identify potential entry areas, nearby targets, and levels where a directional thesis may become invalid.
- **Intraday Focus:** Designed for traders analyzing short-term SPY movements and rapidly changing market conditions.
### How to Use
Monitor how SPY behaves around each $0.50 grid level. Look for agreement between price action, CVD direction, and the market's reaction to key levels. Stronger alignment may provide more meaningful directional evidence than any single signal.
**Important:** This indicator is an analytical tool, not an automated trading system or a guarantee of future price movement. CVD calculations may be estimates derived from available chart data and should not be interpreted as definitive exchange-level order flow. Always apply independent risk management.

Thông báo miễn trừ trách nhiệm
Thông tin và các ấn phẩm này không nhằm mục đích, và không cấu thành, lời khuyên hoặc khuyến nghị về tài chính, đầu tư, giao dịch hay các loại khác do TradingView cung cấp hoặc xác nhận. Đọc thêm tại Điều khoản Sử dụng.
Thông báo miễn trừ trách nhiệm
Thông tin và các ấn phẩm này không nhằm mục đích, và không cấu thành, lời khuyên hoặc khuyến nghị về tài chính, đầu tư, giao dịch hay các loại khác do TradingView cung cấp hoặc xác nhận. Đọc thêm tại Điều khoản Sử dụng.