MTF Magnets: Liquidity Magnets Across Multiple Timeframes
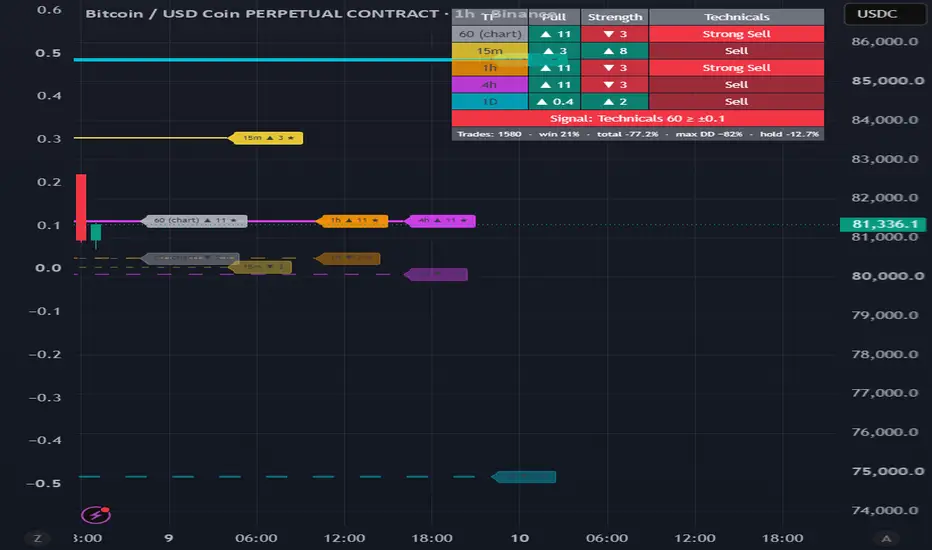
The indicator finds price levels where other traders' stop-losses and liquidations are clustered. Price is often drawn to these levels to collect that liquidity. It runs on 5 timeframes at once: the chart timeframe plus four you choose (15m, 1h, 4h and 1D by default). It also adds a technical rating for each timeframe and BUY/SELL signals.
1. How magnets are calculated
Three types of levels are collected:
Stops beyond swings. Swing highs and lows that price hasn't broken yet. Weight 2.
Previous day high/low, if it hasn't been touched today. Weight 2.
Estimated liquidations at 25x, 50x and 100x leverage, taken from candles with volume at least 2× above average. Weight 1. This is a model, not real exchange data.
Levels within 0.15% of each other are merged into one cluster.
Strength is the sum of the weights in a cluster, i.e. how much liquidity sits there.
Pull is strength divided by the distance from price in %, so it combines how much liquidity there is and how close it is.
The cluster with the highest pull above price is the upper magnet, and the same below price gives the lower magnet.
2. Technical rating
This rating uses 26 indicators: 15 moving averages and 11 oscillators (RSI, MACD, Stochastic and others). The rules are the same as TradingView's Technical Ratings. The result is one of Strong Buy / Buy / Neutral / Sell / Strong Sell.
3. Table (top right)
TF Pull Strength Technicals
1h ▲ 9.1 ▼ 11 Buy
Pull and Strength show the stronger side with an arrow. Green means up, red means down.
Below the table you'll find the current signal state and stats. The stats show the number of trades, win rate, total return in % after fees, max drawdown, and buy-and-hold for comparison.
4. Lines on the chart
Each timeframe's magnets are drawn in their own color: 15m yellow, 1h orange, 4h pink, 1D cyan. Higher timeframes get thicker lines. A solid line with ★ marks the stronger side, a dashed line the weaker side.
5. BUY / SELL signals
By default, signals come from technical analysis on the chart timeframe. BUY fires when the rating reaches Buy, SELL fires when it reaches Sell.
Signals don't repeat until a reversal: after a BUY, the next signal can only be a SELL.
Signals appear when the candle closes. Higher-timeframe values come from closed candles, so signals don't repaint on history.
You can also take signals from technicals across all timeframes, or from a combined Pull + Strength + Technicals vote across all timeframes.
BUY and SELL alerts are available.
Main settings
Timeframes: which timeframes appear in the table.
Magnets: swing length, cluster width, max search distance, and whether to include the previous day's high and low.
Signals: signal source, technicals threshold (0.1 = Buy/Sell, 0.5 = Strong), agreement threshold for the all-timeframes mode, and fee used in the stats.
Limitations
Liquidations are estimated. The indicator can't see real positions or leverage.
A magnet shows where liquidity sits, but price isn't guaranteed to go there.
Stats depend on the history TradingView loads. On low timeframes that history is short, and fees have a big impact on results.
1. How magnets are calculated
Three types of levels are collected:
Stops beyond swings. Swing highs and lows that price hasn't broken yet. Weight 2.
Previous day high/low, if it hasn't been touched today. Weight 2.
Estimated liquidations at 25x, 50x and 100x leverage, taken from candles with volume at least 2× above average. Weight 1. This is a model, not real exchange data.
Levels within 0.15% of each other are merged into one cluster.
Strength is the sum of the weights in a cluster, i.e. how much liquidity sits there.
Pull is strength divided by the distance from price in %, so it combines how much liquidity there is and how close it is.
The cluster with the highest pull above price is the upper magnet, and the same below price gives the lower magnet.
2. Technical rating
This rating uses 26 indicators: 15 moving averages and 11 oscillators (RSI, MACD, Stochastic and others). The rules are the same as TradingView's Technical Ratings. The result is one of Strong Buy / Buy / Neutral / Sell / Strong Sell.
3. Table (top right)
TF Pull Strength Technicals
1h ▲ 9.1 ▼ 11 Buy
Pull and Strength show the stronger side with an arrow. Green means up, red means down.
Below the table you'll find the current signal state and stats. The stats show the number of trades, win rate, total return in % after fees, max drawdown, and buy-and-hold for comparison.
4. Lines on the chart
Each timeframe's magnets are drawn in their own color: 15m yellow, 1h orange, 4h pink, 1D cyan. Higher timeframes get thicker lines. A solid line with ★ marks the stronger side, a dashed line the weaker side.
5. BUY / SELL signals
By default, signals come from technical analysis on the chart timeframe. BUY fires when the rating reaches Buy, SELL fires when it reaches Sell.
Signals don't repeat until a reversal: after a BUY, the next signal can only be a SELL.
Signals appear when the candle closes. Higher-timeframe values come from closed candles, so signals don't repaint on history.
You can also take signals from technicals across all timeframes, or from a combined Pull + Strength + Technicals vote across all timeframes.
BUY and SELL alerts are available.
Main settings
Timeframes: which timeframes appear in the table.
Magnets: swing length, cluster width, max search distance, and whether to include the previous day's high and low.
Signals: signal source, technicals threshold (0.1 = Buy/Sell, 0.5 = Strong), agreement threshold for the all-timeframes mode, and fee used in the stats.
Limitations
Liquidations are estimated. The indicator can't see real positions or leverage.
A magnet shows where liquidity sits, but price isn't guaranteed to go there.
Stats depend on the history TradingView loads. On low timeframes that history is short, and fees have a big impact on results.

Thông báo miễn trừ trách nhiệm
Thông tin và các ấn phẩm này không nhằm mục đích, và không cấu thành, lời khuyên hoặc khuyến nghị về tài chính, đầu tư, giao dịch hay các loại khác do TradingView cung cấp hoặc xác nhận. Đọc thêm tại Điều khoản Sử dụng.
Thông báo miễn trừ trách nhiệm
Thông tin và các ấn phẩm này không nhằm mục đích, và không cấu thành, lời khuyên hoặc khuyến nghị về tài chính, đầu tư, giao dịch hay các loại khác do TradingView cung cấp hoặc xác nhận. Đọc thêm tại Điều khoản Sử dụng.