OPEN-SOURCE SCRIPT
Cập nhật Quantum Dynamic Mitigation Zones v1
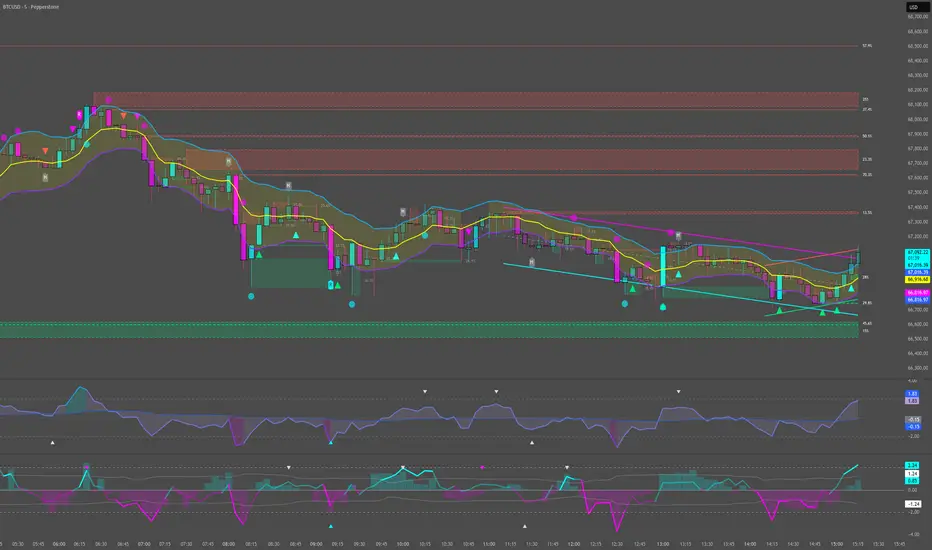
Quantum Dynamic Mitigation Zones - Institutional Order Flow Support/Resistance
Overview
Traditional Support and Resistance lines rely on lagging historical pivots. The Quantum Dynamic Mitigation Zones indicator brings true institutional order flow to your charts. It scans for massive, statistically significant volume anomalies (Whale executions) and draws rigid Supply and Demand zones forward in time. Most importantly, it visually simulates order book "Mitigation"—as price wicks back into these zones, the boxes physically shrink, showing you exactly how much institutional liquidity has been "eaten" before the level finally breaks.
Key Highlights
• Anomaly Detection: Scans the current timeframe for extreme volume spikes (e.g., 300%+ above the moving average) to identify where institutional money stepped in.
• Dynamic Mitigation Engine: As future price action retraces into a drawn zone, the script permanently erases the portion of the box that price touched.
• Visual Liquidity: Instead of guessing if a level is still strong, you can literally see if the box is wide and heavily defended, or if it has been reduced to a thin sliver about to break.
How to Trade It
When an anomaly zone is first created, do not chase the breakout. Wait for price to naturally retrace back to the box. If the price taps the edge of the box and rejects strongly, buy/sell the bounce. If price begins heavily "eating" into the box, narrowing its size, assume the institutional defense is depleted and prepare to trade the continuation breakout through the zone.
⚠️ DISCLAIMER: STRICTLY FOR EDUCATIONAL PURPOSES
The information, scripts, and concepts provided in this publication are for educational and informational purposes only and do not constitute financial, investment, or trading advice. Trading in financial markets (including Forex, Crypto, Stocks, and Commodities) carries a high level of risk and may not be suitable for all investors. You could lose some or all of your initial investment. Past performance is not indicative of future results. Always conduct your own due diligence, backtest any strategy thoroughly, and consult with a certified financial advisor before making any trading decisions. By using this script, you acknowledge that you are solely responsible for your own trading actions and outcomes.
Overview
Traditional Support and Resistance lines rely on lagging historical pivots. The Quantum Dynamic Mitigation Zones indicator brings true institutional order flow to your charts. It scans for massive, statistically significant volume anomalies (Whale executions) and draws rigid Supply and Demand zones forward in time. Most importantly, it visually simulates order book "Mitigation"—as price wicks back into these zones, the boxes physically shrink, showing you exactly how much institutional liquidity has been "eaten" before the level finally breaks.
Key Highlights
• Anomaly Detection: Scans the current timeframe for extreme volume spikes (e.g., 300%+ above the moving average) to identify where institutional money stepped in.
• Dynamic Mitigation Engine: As future price action retraces into a drawn zone, the script permanently erases the portion of the box that price touched.
• Visual Liquidity: Instead of guessing if a level is still strong, you can literally see if the box is wide and heavily defended, or if it has been reduced to a thin sliver about to break.
How to Trade It
When an anomaly zone is first created, do not chase the breakout. Wait for price to naturally retrace back to the box. If the price taps the edge of the box and rejects strongly, buy/sell the bounce. If price begins heavily "eating" into the box, narrowing its size, assume the institutional defense is depleted and prepare to trade the continuation breakout through the zone.
⚠️ DISCLAIMER: STRICTLY FOR EDUCATIONAL PURPOSES
The information, scripts, and concepts provided in this publication are for educational and informational purposes only and do not constitute financial, investment, or trading advice. Trading in financial markets (including Forex, Crypto, Stocks, and Commodities) carries a high level of risk and may not be suitable for all investors. You could lose some or all of your initial investment. Past performance is not indicative of future results. Always conduct your own due diligence, backtest any strategy thoroughly, and consult with a certified financial advisor before making any trading decisions. By using this script, you acknowledge that you are solely responsible for your own trading actions and outcomes.
Phát hành các Ghi chú
Added a grading system to the S/R zones.Mã nguồn mở
Theo đúng tinh thần TradingView, tác giả của tập lệnh này đã công bố nó dưới dạng mã nguồn mở, để các nhà giao dịch có thể xem xét và xác minh chức năng. Chúc mừng tác giả! Mặc dù bạn có thể sử dụng miễn phí, hãy nhớ rằng việc công bố lại mã phải tuân theo Nội quy.

Thông báo miễn trừ trách nhiệm
Thông tin và các ấn phẩm này không nhằm mục đích, và không cấu thành, lời khuyên hoặc khuyến nghị về tài chính, đầu tư, giao dịch hay các loại khác do TradingView cung cấp hoặc xác nhận. Đọc thêm tại Điều khoản Sử dụng.
Mã nguồn mở
Theo đúng tinh thần TradingView, tác giả của tập lệnh này đã công bố nó dưới dạng mã nguồn mở, để các nhà giao dịch có thể xem xét và xác minh chức năng. Chúc mừng tác giả! Mặc dù bạn có thể sử dụng miễn phí, hãy nhớ rằng việc công bố lại mã phải tuân theo Nội quy.
Thông báo miễn trừ trách nhiệm
Thông tin và các ấn phẩm này không nhằm mục đích, và không cấu thành, lời khuyên hoặc khuyến nghị về tài chính, đầu tư, giao dịch hay các loại khác do TradingView cung cấp hoặc xác nhận. Đọc thêm tại Điều khoản Sử dụng.