OPEN-SOURCE SCRIPT
Cập nhật TGIF Weekly Retracement+ (M1D)
TGIF "Thank God It's Friday"-
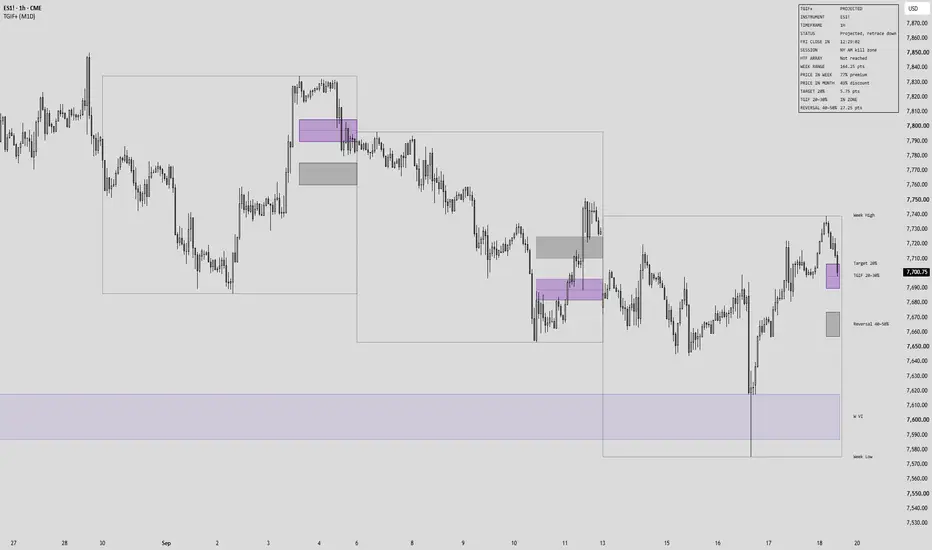
Is a weekly retracement model taught by ICT. It is day-specific: it appears once a week, on Friday. Once the week has expanded and delivered into a higher-timeframe objective, Friday's job is not more expansion but a retracement back inside the weekly range — roughly 20-30% of that range given back before the weekly close. Structurally it is the distribution phase of the weekly Power 3.
This script measures the range and maps the draw. It takes no directional opinion of its own.
THE RANGE-
The weekly range is the lowest low of the week up to its highest high. Both anchors are weekly extremes, so the percentages are cut from the weekly range itself.
Direction comes from the sequence of those two extremes. Whichever printed later is the terminus the retracement runs back from; the opposite extreme is the origin. A week making higher highs into Friday is measured low to high; a week that topped midweek and sold off into Friday is measured high to low. The read refreshes on every confirmed bar, so a week that re-expands and takes its other side flips the measurement with it.
THE PRECONDITION-
The model expects price to have already delivered into a higher-timeframe premium array in a bullish week, or a discount array in a bearish week. Without that the week can keep expanding and close on its extreme with no retracement at all. It is the condition that separates the two, so it is checked rather than assumed, and enforced by default.
Monthly, Weekly and 3D are scanned. Each keeps at most one discount and one premium array, the most recent to pass validation. Two kinds of void qualify: a three-candle displacement gap, where an order block registers only if its displacement left a gap and the gap only registers if it clears a height floor with a real body behind it; and the void across a candle boundary, from one higher-timeframe candle's close to the next one's open, which nothing traded through at all — on the weekly, the weekend.
A week qualifies when its terminus extreme has traded a set depth into one of those arrays, 25% by default, measured from the edge price approached. The array checked is the one opposite the week's direction: a bullish week rallies into premium, a bearish week drops into discount. Because the test runs against that week's own extreme it reads correctly on every week in history, and the dashboard names what qualified it.
One array per side is drawn by default, highest timeframe winning where two overlap in price. Raising the count draws the next one down that sits elsewhere. That is display only — the check reads every array found, so tidying the chart cannot change which weeks qualify. An array stays drawn until price has traded fully through it.
A SPENT DRAW IS NOT A SETUP-
Friday is meant to deliver the give-back. A week that already paid it out on Wednesday has nothing left, however cleanly the rest reads. The deepest pullback from the terminus is tracked, and if it reached the retracement band before Friday the week is marked as worked rather than shown as live. That measurement restarts whenever the terminus moves, since a new extreme begins a new leg with its own untouched draw.
A stricter reading is available, off by default: require the terminus to have formed on Thursday or Friday.
(Visual shows the setting ON)
CONFIRMATION-
Friday's swing sets no level. It is the gate on conviction: a swing on the terminus side, confirmed on the 15M or 30M and held on a closing basis. The zones are a draw on liquidity, drawn in anticipation rather than waited on, which is how the model is used. Confirmation fires the alert and locks the measurement, so the levels stop moving. If the swing is later broken the lock releases and it re-arms on the next one.
Before that lock the levels do move, because the weekly range is not final until the extreme stops extending. That is the model rather than a repaint: nothing is read from an unclosed bar, no decision taken on a closed bar is ever revised, and the confirmation timeframe is requested one bar back so no forming higher-timeframe bar can contribute a pivot that later disappears.
WHAT IT DRAWS-
- The weekly range as an outline: a dotted level on each extreme, each beginning at the candle that formed it, closed by a riser at each end. It draws from early in the week.
- TGIF 20-30%, the retracement zone measured from the terminus back inside the range, with a midline through it — the 25% marker at default settings. The zones begin at the candle that formed the terminus, since a retracement cannot start before the extreme it runs back from exists.
- A reversal band beyond the draw. Not a target: past roughly 40% the move stops describing a Friday retracement and starts describing a larger reversal, and by 50% most of a TGIF position would already be off.
- The higher-timeframe arrays, captioned BISI, SIBI, OB+, OB- or VI alongside the timeframe that owns them.
- A dashboard carrying the chart timeframe, a countdown to the Friday close, model status, the array that qualified the week, the weekly range in points, and the distance from price to each zone.
Callouts sit at the right edge of the drawing, spaced by ATR-derived clearance so they do not stack on one another.
SETTINGS-
- Timezone, IANA format, defaulting to America/New_York. All day-of-week resolution uses it.
- Whether delivery into a higher-timeframe array is required, which of the three timeframes are scanned, the depth that counts as delivery, and how many arrays are drawn per side.
- Whether the terminus must have formed on Thursday or Friday, and how many completed weeks stay on the chart.
- The Friday hour past which the extreme is treated as set, 13:30 by default. Reported in the dashboard; it does not stop the anchors tracking a genuine new extreme.
- Swing confirmation timeframe, 15M or 30M, with adjustable pivot bars.
- Both bands are adjustable. 20/30 and 40/50 are defaults, not fixed values.
- Colours, label visibility and offset, dashboard position, and the Friday close time the countdown counts to.
NOTES-
- Non-repainting. All structure is read on closed bars.
- Completed weeks stay on the chart behind the current one, two by default and up to eight, frozen as they finished and with their callouts dropped so old text does not sit over live price. Set the count to zero for the current week only.
- Three alert conditions: Friday swing confirmed, price tapping the retracement zone, and price entering the reversal band.
- This is a mapping tool. It draws the model's levels and reports where price sits relative to them; it produces no entries, targets or stops. ICT is explicit that TGIF supplies the draw and the day, and that the entry is whichever of his models you prefer.
Disclaimer-
This is not financial advice. Levels drawn by a model are context, not a recommendation to trade, and the past behaviour of a weekly range says nothing certain about the next one.
Is a weekly retracement model taught by ICT. It is day-specific: it appears once a week, on Friday. Once the week has expanded and delivered into a higher-timeframe objective, Friday's job is not more expansion but a retracement back inside the weekly range — roughly 20-30% of that range given back before the weekly close. Structurally it is the distribution phase of the weekly Power 3.
This script measures the range and maps the draw. It takes no directional opinion of its own.
THE RANGE-
The weekly range is the lowest low of the week up to its highest high. Both anchors are weekly extremes, so the percentages are cut from the weekly range itself.
Direction comes from the sequence of those two extremes. Whichever printed later is the terminus the retracement runs back from; the opposite extreme is the origin. A week making higher highs into Friday is measured low to high; a week that topped midweek and sold off into Friday is measured high to low. The read refreshes on every confirmed bar, so a week that re-expands and takes its other side flips the measurement with it.
THE PRECONDITION-
The model expects price to have already delivered into a higher-timeframe premium array in a bullish week, or a discount array in a bearish week. Without that the week can keep expanding and close on its extreme with no retracement at all. It is the condition that separates the two, so it is checked rather than assumed, and enforced by default.
Monthly, Weekly and 3D are scanned. Each keeps at most one discount and one premium array, the most recent to pass validation. Two kinds of void qualify: a three-candle displacement gap, where an order block registers only if its displacement left a gap and the gap only registers if it clears a height floor with a real body behind it; and the void across a candle boundary, from one higher-timeframe candle's close to the next one's open, which nothing traded through at all — on the weekly, the weekend.
A week qualifies when its terminus extreme has traded a set depth into one of those arrays, 25% by default, measured from the edge price approached. The array checked is the one opposite the week's direction: a bullish week rallies into premium, a bearish week drops into discount. Because the test runs against that week's own extreme it reads correctly on every week in history, and the dashboard names what qualified it.
One array per side is drawn by default, highest timeframe winning where two overlap in price. Raising the count draws the next one down that sits elsewhere. That is display only — the check reads every array found, so tidying the chart cannot change which weeks qualify. An array stays drawn until price has traded fully through it.
A SPENT DRAW IS NOT A SETUP-
Friday is meant to deliver the give-back. A week that already paid it out on Wednesday has nothing left, however cleanly the rest reads. The deepest pullback from the terminus is tracked, and if it reached the retracement band before Friday the week is marked as worked rather than shown as live. That measurement restarts whenever the terminus moves, since a new extreme begins a new leg with its own untouched draw.
A stricter reading is available, off by default: require the terminus to have formed on Thursday or Friday.
(Visual shows the setting ON)
CONFIRMATION-
Friday's swing sets no level. It is the gate on conviction: a swing on the terminus side, confirmed on the 15M or 30M and held on a closing basis. The zones are a draw on liquidity, drawn in anticipation rather than waited on, which is how the model is used. Confirmation fires the alert and locks the measurement, so the levels stop moving. If the swing is later broken the lock releases and it re-arms on the next one.
Before that lock the levels do move, because the weekly range is not final until the extreme stops extending. That is the model rather than a repaint: nothing is read from an unclosed bar, no decision taken on a closed bar is ever revised, and the confirmation timeframe is requested one bar back so no forming higher-timeframe bar can contribute a pivot that later disappears.
WHAT IT DRAWS-
- The weekly range as an outline: a dotted level on each extreme, each beginning at the candle that formed it, closed by a riser at each end. It draws from early in the week.
- TGIF 20-30%, the retracement zone measured from the terminus back inside the range, with a midline through it — the 25% marker at default settings. The zones begin at the candle that formed the terminus, since a retracement cannot start before the extreme it runs back from exists.
- A reversal band beyond the draw. Not a target: past roughly 40% the move stops describing a Friday retracement and starts describing a larger reversal, and by 50% most of a TGIF position would already be off.
- The higher-timeframe arrays, captioned BISI, SIBI, OB+, OB- or VI alongside the timeframe that owns them.
- A dashboard carrying the chart timeframe, a countdown to the Friday close, model status, the array that qualified the week, the weekly range in points, and the distance from price to each zone.
Callouts sit at the right edge of the drawing, spaced by ATR-derived clearance so they do not stack on one another.
SETTINGS-
- Timezone, IANA format, defaulting to America/New_York. All day-of-week resolution uses it.
- Whether delivery into a higher-timeframe array is required, which of the three timeframes are scanned, the depth that counts as delivery, and how many arrays are drawn per side.
- Whether the terminus must have formed on Thursday or Friday, and how many completed weeks stay on the chart.
- The Friday hour past which the extreme is treated as set, 13:30 by default. Reported in the dashboard; it does not stop the anchors tracking a genuine new extreme.
- Swing confirmation timeframe, 15M or 30M, with adjustable pivot bars.
- Both bands are adjustable. 20/30 and 40/50 are defaults, not fixed values.
- Colours, label visibility and offset, dashboard position, and the Friday close time the countdown counts to.
NOTES-
- Non-repainting. All structure is read on closed bars.
- Completed weeks stay on the chart behind the current one, two by default and up to eight, frozen as they finished and with their callouts dropped so old text does not sit over live price. Set the count to zero for the current week only.
- Three alert conditions: Friday swing confirmed, price tapping the retracement zone, and price entering the reversal band.
- This is a mapping tool. It draws the model's levels and reports where price sits relative to them; it produces no entries, targets or stops. ICT is explicit that TGIF supplies the draw and the day, and that the entry is whichever of his models you prefer.
Disclaimer-
This is not financial advice. Levels drawn by a model are context, not a recommendation to trade, and the past behaviour of a weekly range says nothing certain about the next one.
Phát hành các Ghi chú
Setup window.The model now runs from Thursday 13:00 New York through the end of Friday, not Friday alone. The retracement zones draw inside that window and the confirming swing only counts inside it. The opening hour is a setting under TGIF Model.
Target level.
A solid level now marks the first objective of the draw at 20% of the weekly range, measured from the terminus extreme back inside the range. It carries its own label, a distance row in the dashboard, and a new alert, TGIF target reached. The percentage and the level itself can be changed or switched off under Zones.
Daily arrays.
The higher-timeframe array scan now reads Monthly, Weekly and Daily. Daily replaces the 3D timeframe.
5M confirmation.
The swing confirmation timeframe now offers 5M alongside 15M and 30M. 15M stays the default.
Dashboard.
Three new rows. Session shows whether the current bar is in the NY AM kill zone (07:00 to 09:00 New York), the NY open (09:30 to 11:00 New York) or outside both. Price in week and Price in month show where price sits in the current weekly and monthly range as a percentage, and whether that is premium or discount.
Colours.
The range outline, callout backgrounds and dashboard grid now use true black.
Phát hành các Ghi chú
A clearer dashboardThe dashboard is now ink on the chart with no fill and no gridlines, in the same style as the other M1D panels. It opens with the instrument and timeframe, and the top line reads PROJECTED or LOCKED once the zones are live. Hover any row to see what it means and how the number was worked out: the week range shows the high minus the low, and the target shows the extreme, the percentage and the level it lands on. Rows with nothing to report are left out. A new Text size setting under Labels sizes both the labels and the dashboard.
One box for the whole week
The weekly range is now one dotted box, end to end: from the week's first candle to the live candle, top at the week high and bottom at the week low. It replaces the separate level lines and risers.
The retracement on every week
The target, the 20-30% retracement zone, its midline and the reversal band now draw on every week with a range, so where the retracement sits can always be checked by eye. On a week the model has qualified they are drawn solid; on a week it has not, they are dotted and the dashboard's top line reads REFERENCE, with STATUS saying why. Alerts still fire only on qualified weeks.
Array names beside the box
Higher-timeframe arrays now carry their name as a label past the right edge, on the box's centre line, instead of inside the box, so the name stays readable when the box is thin. Chart labels sit on their own prices rather than being pushed apart.
Higher-timeframe arrays on time
Monthly, weekly and daily arrays now appear from the opening of the candle after they formed, on history the same as live. History previously showed each one a full higher-timeframe candle late. The swing confirmation reads the same way.
A array counts only if it was there first
The delivery check now ignores a array that formed after the week's extreme printed. A array that forms during the pullback sits below a high or above a low by construction, and it was being counted as the array the week delivered into.
A spent array stays spent
A array now retires when a candle closes through it; a wick through is a touch and leaves it standing. Once retired it no longer comes back while its higher-timeframe candle is still open.
The extreme's own candle is not a pullback
The check for a draw already worked before the window opens now starts on the candle after the extreme. The candle that printed the extreme had its other end traded on the way in, and on higher timeframes that alone could mark a week as spent.
Swing alert only on a live setup
TGIF swing confirmed now fires only when the zones are live, not on a week the model has already ruled out.
Mã nguồn mở
Theo đúng tinh thần TradingView, tác giả của tập lệnh này đã công bố nó dưới dạng mã nguồn mở, để các nhà giao dịch có thể xem xét và xác minh chức năng. Chúc mừng tác giả! Mặc dù bạn có thể sử dụng miễn phí, hãy nhớ rằng việc công bố lại mã phải tuân theo Nội quy.

Thông báo miễn trừ trách nhiệm
Thông tin và các ấn phẩm này không nhằm mục đích, và không cấu thành, lời khuyên hoặc khuyến nghị về tài chính, đầu tư, giao dịch hay các loại khác do TradingView cung cấp hoặc xác nhận. Đọc thêm tại Điều khoản Sử dụng.
Mã nguồn mở
Theo đúng tinh thần TradingView, tác giả của tập lệnh này đã công bố nó dưới dạng mã nguồn mở, để các nhà giao dịch có thể xem xét và xác minh chức năng. Chúc mừng tác giả! Mặc dù bạn có thể sử dụng miễn phí, hãy nhớ rằng việc công bố lại mã phải tuân theo Nội quy.
Thông báo miễn trừ trách nhiệm
Thông tin và các ấn phẩm này không nhằm mục đích, và không cấu thành, lời khuyên hoặc khuyến nghị về tài chính, đầu tư, giao dịch hay các loại khác do TradingView cung cấp hoặc xác nhận. Đọc thêm tại Điều khoản Sử dụng.