Cập nhật
Multiple Timeframe Levels
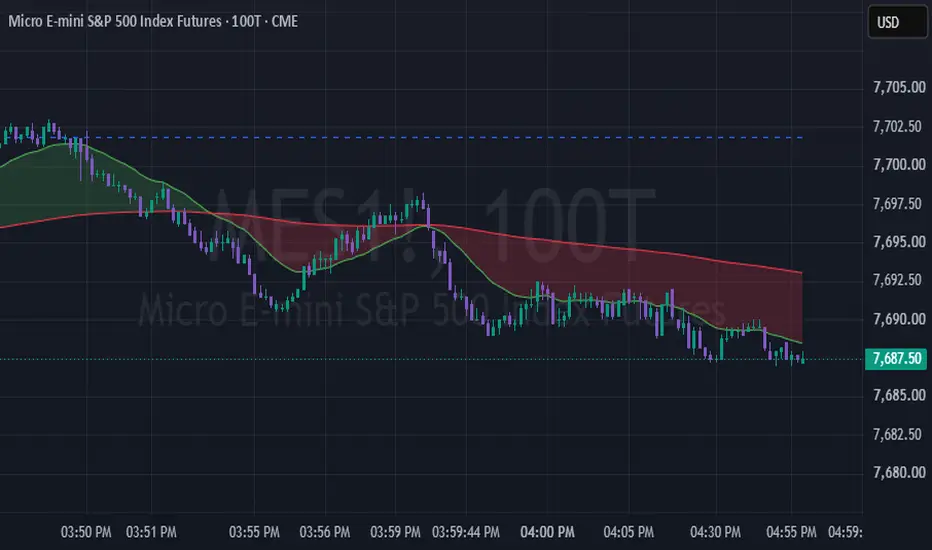
The multiple timeframe levels indicator plots the following lines on your chart:
This indicator makes it easy to plot the high timeframe levels on your chart so that you can focus on your preferred timeframe for trading. This can be used however you see fit. These levels are great for finding support and resistance, setting your stop losses and take profits, looking for reversals, etc.
You can customize this script my enabling/disabling the timeframe's high/low or midpoint as well as the color.
- Previous day's high, low, and midpoint
- Previous week's high, low, and midpoint
- Previous month's high, low, and midpoint
- Overnight session high, low, and midpoint
This indicator makes it easy to plot the high timeframe levels on your chart so that you can focus on your preferred timeframe for trading. This can be used however you see fit. These levels are great for finding support and resistance, setting your stop losses and take profits, looking for reversals, etc.
You can customize this script my enabling/disabling the timeframe's high/low or midpoint as well as the color.
Phát hành các Ghi chú
The multiple timeframe levels indicator plots the following lines on your chart:- Previous day's high, low, and midpoint
- Previous week's high, low, and midpoint
- Previous month's high, low, and midpoint
- Overnight session high, low, and midpoint
This indicator makes it easy to plot the high timeframe levels on your chart so that you can focus on your preferred timeframe for trading. This can be used however you see fit. These levels are great for finding support and resistance, setting your stop losses and take profits, looking for reversals, etc.
You can customize this script my enabling/disabling the timeframe's high/low or midpoint as well as the color.
Phát hành các Ghi chú
Fixed script error on tick based chartsPhát hành các Ghi chú
MTF LEVELSPlots the higher-timeframe reference levels that intraday traders actually use, on any
chart timeframe — including tick charts — with clean, collision-aware labels.
LEVELS
- Prior Day High / Low
- Prior Day Midpoint
- Prior Day Settlement (daily close)
- Prior RTH High / Low (regular session only — often more relevant than the full-day
extremes when overnight moved the range)
- Overnight High / Low (current session)
- Prior Week High / Low
- Month High / Low and Prior Month High / Low
HOW IT WORKS
- All session levels are computed on a fixed intraday timeframe via request.security,
so ONH/ONL and RTH H/L are correct no matter what chart resolution you're on —
they don't recalculate or distort on higher-timeframe or tick charts.
- Overnight levels auto-hide above a configurable chart timeframe (default 60 min),
where they stop being meaningful.
- Labels are collision-aware: when two levels sit at or near the same price, their
labels merge into one (e.g. "PDH · PWH") at the cluster's price, instead of
overlapping into an unreadable stack.
- Every level has its own color, style, and visibility toggle. Line and label colors
stay matched.
SETTINGS
Each level group can be toggled independently. Colors are chosen to stay readable
against both light and dark themes and to keep every level visually distinct.
WHAT'S NEW IN THIS VERSION
- Added Prior Day Settlement (orange, dotted)
- Added Prior RTH High / Low as separate levels from the full-day PDH/PDL
- Fixed: ONH/ONL previously plotted incorrectly on higher chart timeframes — session
levels are now computed on a fixed lower timeframe regardless of chart resolution
- Fixed: prior-day midpoint color input was not being applied
- New label engine: merged, collision-aware labels replace overlapping label stacks
- Distinct default colors across all level families
Works on futures and other symbols with defined sessions. Session times follow the
exchange timezone.

Thông báo miễn trừ trách nhiệm
Thông tin và các ấn phẩm này không nhằm mục đích, và không cấu thành, lời khuyên hoặc khuyến nghị về tài chính, đầu tư, giao dịch hay các loại khác do TradingView cung cấp hoặc xác nhận. Đọc thêm tại Điều khoản Sử dụng.
Thông báo miễn trừ trách nhiệm
Thông tin và các ấn phẩm này không nhằm mục đích, và không cấu thành, lời khuyên hoặc khuyến nghị về tài chính, đầu tư, giao dịch hay các loại khác do TradingView cung cấp hoặc xác nhận. Đọc thêm tại Điều khoản Sử dụng.