OPEN-SOURCE SCRIPT
QuantumPips Adaptive Fib Bands
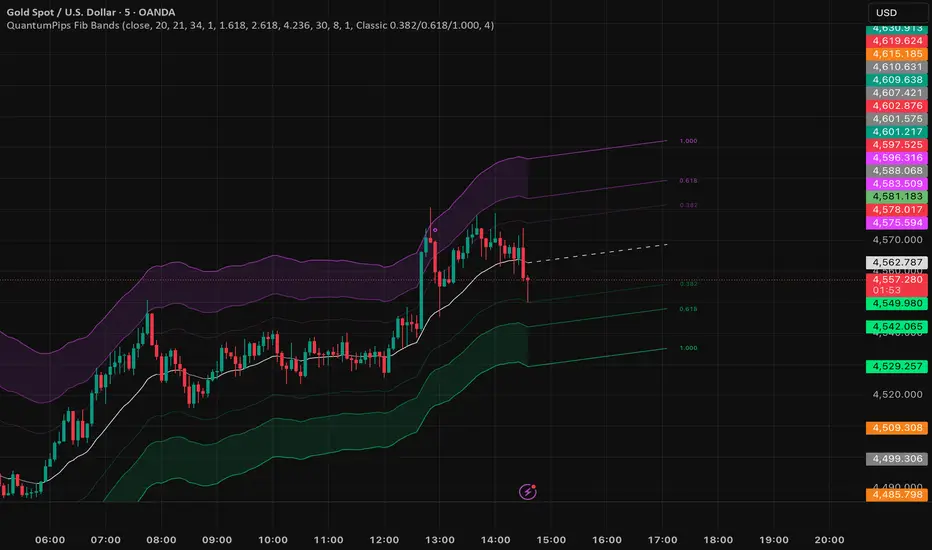
QuantumPips Adaptive Fib Bands is a volatility “map” that wraps price in dynamic bands.
Instead of using fixed distances, the bands expand and contract with the market using ATR (volatility). This helps you quickly see when the price is acting normal, stretched, or extreme.
What you’re looking at
1) The middle line (Basis)
The Basis is a smoothed average price (EMA).
Think of it as the market’s “fair value” line for the current timeframe.
When price is around the Basis, the market is usually balanced.
When price pulls away from the Basis, the market is stretching.
2) The bands (Top/Bottom levels)
Above and below the Basis you’ll see three levels.
Band 1 = normal volatility move
Band 2 = stretched move
Band 3 = extreme move
The distances are based on a smoothed ATR, then scaled by the multipliers (your ratios).
3) The right side Fib numbers
On the right, the labels mark the projected band levels so you can read them quickly.
You can show either:
classic “Fib-style” labels (0.382 / 0.618 / 1.000), or
your exact ratio values (1.618 / 2.618 / 4.236)
4) Projection lines (optional)
If Projection is enabled, the script draws the bands forward by a set number of bars.
This is not a prediction, it simply extends the current slope of the Basis forward so you can visualize where the envelope would sit if conditions stay similar.
5) Sweep hints (optional)
Sweep hints appear when the price pushes beyond the outer band and then shows immediate hesitation/pressure back inside.
It’s meant as a “pay attention here” marker, not a trade signal by itself.
How traders use it:
A) Trend + pullback context
Use the Basis as the trend reference:
In an uptrend, pullbacks into the lower bands often act as “discount areas.”
In a downtrend, pushes into the upper bands often act as “premium areas.”
You still wait for your own confirmation (rejection candle, structure shift, session level, etc.).
B) Overextension spotting
When price reaches Band 3, it’s an “extreme stretch” versus current volatility.
That’s useful because:
Continuation can still happen, but reversals and sharp pullbacks become more likely, especially around session highs/lows
C) Range / chop conditions
If price keeps crossing the Basis and bouncing between Band 1 areas, the market is often ranging.
In that case:
Band 2–3 acts more like “range edges,”
and the Basis is often the mid-range magnet.
D) Target planning (clean visuals)
Bands can be used as natural reference points for:
take-profit zones,
“where price is likely to slow down,”
and mapping where the next volatility expansion might reach.
Mã nguồn mở
Theo đúng tinh thần TradingView, tác giả của tập lệnh này đã công bố nó dưới dạng mã nguồn mở, để các nhà giao dịch có thể xem xét và xác minh chức năng. Chúc mừng tác giả! Mặc dù bạn có thể sử dụng miễn phí, hãy nhớ rằng việc công bố lại mã phải tuân theo Nội quy.

QuantumPips — Trade Structure. Not Noise.
Market Structure Pro (Invite-only): quantumpips.io/msp
Educational only. Not financial advice.
Market Structure Pro (Invite-only): quantumpips.io/msp
Educational only. Not financial advice.
Thông báo miễn trừ trách nhiệm
Thông tin và các ấn phẩm này không nhằm mục đích, và không cấu thành, lời khuyên hoặc khuyến nghị về tài chính, đầu tư, giao dịch hay các loại khác do TradingView cung cấp hoặc xác nhận. Đọc thêm tại Điều khoản Sử dụng.
Mã nguồn mở
Theo đúng tinh thần TradingView, tác giả của tập lệnh này đã công bố nó dưới dạng mã nguồn mở, để các nhà giao dịch có thể xem xét và xác minh chức năng. Chúc mừng tác giả! Mặc dù bạn có thể sử dụng miễn phí, hãy nhớ rằng việc công bố lại mã phải tuân theo Nội quy.
QuantumPips — Trade Structure. Not Noise.
Market Structure Pro (Invite-only): quantumpips.io/msp
Educational only. Not financial advice.
Market Structure Pro (Invite-only): quantumpips.io/msp
Educational only. Not financial advice.
Thông báo miễn trừ trách nhiệm
Thông tin và các ấn phẩm này không nhằm mục đích, và không cấu thành, lời khuyên hoặc khuyến nghị về tài chính, đầu tư, giao dịch hay các loại khác do TradingView cung cấp hoặc xác nhận. Đọc thêm tại Điều khoản Sử dụng.