OPEN-SOURCE SCRIPT
MTF Candle Status Dashboard: Real-Time Volume & Momentum
Description
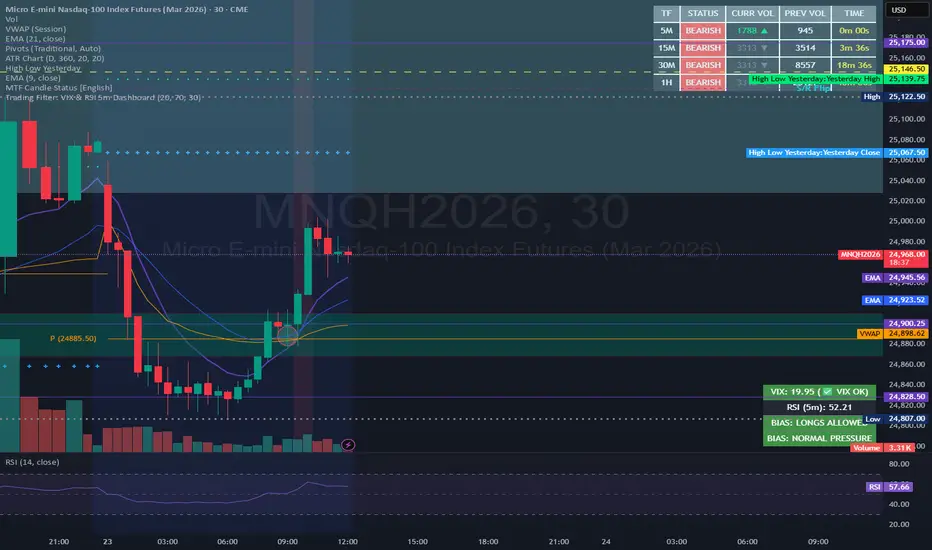
This high-contrast dashboard provides a comprehensive view of market momentum across multiple timeframes (5m, 15m, 30m, and 1h) directly on your main chart. It is specifically designed for day traders who need to monitor price sentiment and volume breakouts simultaneously without switching tabs.
Key Features:
Multi-Timeframe Analysis: Real-time monitoring of the 5-minute, 15-minute, 30-minute, and 1-hour candles.
Live Sentiment Tracking: Instantly see if the current price action is Bullish or Bearish across all periods.
Smart Volume Breakout Indicator: Compares the Current Volume of the live candle against the Previous Candle's Volume.
▲ (Lime Green): Current volume has already exceeded the previous candle's total volume (High Momentum).
▼ (Gray): Current volume is still lower than the previous candle.
Integrated Countdown Timer: A precision timer for each timeframe showing exactly how much time remains before the current candle closes.
High-Contrast UI: Optimized for both dark and light themes with a black background and bold colors to ensure readability over complex indicators or price action.
How to use it:
Confluence: Look for moments where all timeframes turn the same color (e.g., all Green). This indicates strong trend alignment.
Volume Confirmation: When you see a BULLISH status combined with the ▲ symbol in the Volume column, it confirms a high-conviction move supported by increasing market participation.
Timing: Use the TIME column to prepare for entries just before a candle closes or to avoid "fakes" during low-volume periods.
This high-contrast dashboard provides a comprehensive view of market momentum across multiple timeframes (5m, 15m, 30m, and 1h) directly on your main chart. It is specifically designed for day traders who need to monitor price sentiment and volume breakouts simultaneously without switching tabs.
Key Features:
Multi-Timeframe Analysis: Real-time monitoring of the 5-minute, 15-minute, 30-minute, and 1-hour candles.
Live Sentiment Tracking: Instantly see if the current price action is Bullish or Bearish across all periods.
Smart Volume Breakout Indicator: Compares the Current Volume of the live candle against the Previous Candle's Volume.
▲ (Lime Green): Current volume has already exceeded the previous candle's total volume (High Momentum).
▼ (Gray): Current volume is still lower than the previous candle.
Integrated Countdown Timer: A precision timer for each timeframe showing exactly how much time remains before the current candle closes.
High-Contrast UI: Optimized for both dark and light themes with a black background and bold colors to ensure readability over complex indicators or price action.
How to use it:
Confluence: Look for moments where all timeframes turn the same color (e.g., all Green). This indicates strong trend alignment.
Volume Confirmation: When you see a BULLISH status combined with the ▲ symbol in the Volume column, it confirms a high-conviction move supported by increasing market participation.
Timing: Use the TIME column to prepare for entries just before a candle closes or to avoid "fakes" during low-volume periods.
Mã nguồn mở
Theo đúng tinh thần TradingView, tác giả của tập lệnh này đã công bố nó dưới dạng mã nguồn mở, để các nhà giao dịch có thể xem xét và xác minh chức năng. Chúc mừng tác giả! Mặc dù bạn có thể sử dụng miễn phí, hãy nhớ rằng việc công bố lại mã phải tuân theo Nội quy.

Thông báo miễn trừ trách nhiệm
Thông tin và các ấn phẩm này không nhằm mục đích, và không cấu thành, lời khuyên hoặc khuyến nghị về tài chính, đầu tư, giao dịch hay các loại khác do TradingView cung cấp hoặc xác nhận. Đọc thêm tại Điều khoản Sử dụng.
Mã nguồn mở
Theo đúng tinh thần TradingView, tác giả của tập lệnh này đã công bố nó dưới dạng mã nguồn mở, để các nhà giao dịch có thể xem xét và xác minh chức năng. Chúc mừng tác giả! Mặc dù bạn có thể sử dụng miễn phí, hãy nhớ rằng việc công bố lại mã phải tuân theo Nội quy.
Thông báo miễn trừ trách nhiệm
Thông tin và các ấn phẩm này không nhằm mục đích, và không cấu thành, lời khuyên hoặc khuyến nghị về tài chính, đầu tư, giao dịch hay các loại khác do TradingView cung cấp hoặc xác nhận. Đọc thêm tại Điều khoản Sử dụng.