OPEN-SOURCE SCRIPT
SatoshiSignals Momentum Divergence Scanner
Spot the moment buying or selling pressure starts to fade — before price confirms it.
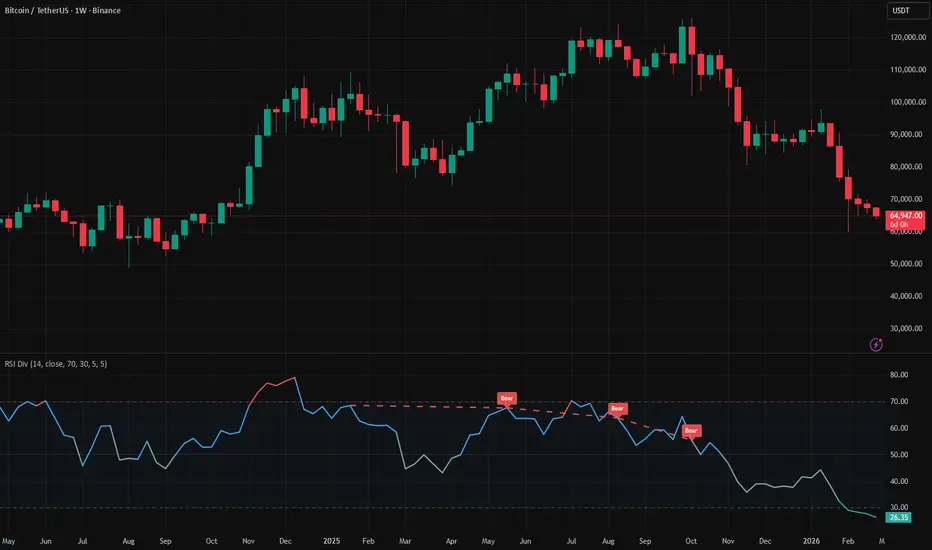
When price keeps climbing but the engine underneath is losing power, a reversal is often not far away. This indicator automatically detects those mismatches — called divergences — and draws them directly on the momentum panel so you never miss one.
──── What You're Looking At ────
A single line displayed in a separate panel below your chart. The line measures momentum — not the direction of price, but how strong the move behind it is. The scale runs from 0 to 100.
──── What Is a Divergence? ────
A divergence happens when price and momentum tell different stories at the same time.
Regular divergences — warn of reversals:
Hidden divergences — warn of trend continuation (optional, off by default):
──── Settings ────
RSI Settings
Divergence Settings
──── Alerts ────
──── Tips ────
When price keeps climbing but the engine underneath is losing power, a reversal is often not far away. This indicator automatically detects those mismatches — called divergences — and draws them directly on the momentum panel so you never miss one.
──── What You're Looking At ────
A single line displayed in a separate panel below your chart. The line measures momentum — not the direction of price, but how strong the move behind it is. The scale runs from 0 to 100.
- Red zone (above 70) — momentum is extremely high. The move may be overextended and running out of fuel.
- Green zone (below 30) — momentum has collapsed. The move may be exhausted in the other direction.
- Blue (50 to 70) — bullish momentum territory. Buyers have the edge.
- Grey (30 to 50) — bearish momentum territory. Sellers have the edge.
──── What Is a Divergence? ────
A divergence happens when price and momentum tell different stories at the same time.
Regular divergences — warn of reversals:
- Bearish divergence (red dashed line + "Bear" label) — price made a higher high, but momentum made a lower high. The last push up was weaker than the one before it. Buyers are tiring. Watch for a move down.
- Bullish divergence (green dashed line + "Bull" label) — price made a lower low, but momentum made a higher low. Sellers are losing their grip. Watch for a move up.
Hidden divergences — warn of trend continuation (optional, off by default):
- Hidden bearish (orange dotted line + "H.Bear" label) — price pulled back to a lower high but momentum spiked above its previous high. The downtrend is likely to resume.
- Hidden bullish (teal dotted line + "H.Bull" label) — price pulled back to a higher low but momentum dipped below its previous low. The uptrend is likely to continue.
──── Settings ────
RSI Settings
- Length — how many bars are used to measure momentum. Default: 14. Lower values (e.g. 7) react faster but produce more noise. Higher values (e.g. 21) are smoother but slower.
- Source — which price point to measure. Default: closing price.
- Overbought / Oversold — the thresholds that define the red and green extreme zones. Default: 70 and 30.
- Show 50 midline — toggles the centre line that separates bullish from bearish territory.
Divergence Settings
- Pivot Left Bars / Pivot Right Bars — controls how many candles must confirm a swing high or low before the indicator treats it as significant. Higher values (e.g. 8–10) produce fewer but more reliable signals. Lower values (e.g. 3) catch more signals but include more noise. Default: 5/5.
- Regular Bearish Div / Regular Bullish Div — toggle reversal divergence signals on or off. Both on by default.
- Hidden Bearish Div / Hidden Bullish Div — toggle continuation divergence signals on or off. Both off by default. Enable when trading with a trend.
- Show Labels — shows or hides the text labels ("Bear", "Bull", "H.Bear", "H.Bull") at each detected point.
──── Alerts ────
- Regular Bullish Divergence — bullish reversal signal detected
- Regular Bearish Divergence — bearish reversal signal detected
- Hidden Bullish Divergence — bullish continuation signal detected
- Hidden Bearish Divergence — bearish continuation signal detected
- Momentum exited overbought zone — line crossed back below 70
- Momentum exited oversold zone — line crossed back above 30
- Momentum crossed above 50 — shifted into bullish territory
- Momentum crossed below 50 — shifted into bearish territory
──── Tips ────
- Divergences are most reliable when they occur at key price levels — a bullish divergence at major support, or a bearish divergence at strong resistance, is significantly more meaningful than one in the middle of a range.
- A divergence is a warning signal, not an immediate entry. Wait for price to actually begin turning before acting. The divergence sets the context; a confirming price candle triggers the trade.
- The wider the price swing that forms the divergence, the more significant the signal. Ignore tiny wiggles — focus on clearly visible swing highs and lows.
- Regular divergences are most useful for catching reversals at market extremes. Hidden divergences are most useful for finding re-entries during pullbacks in a strong trend — they serve very different purposes.
- When multiple divergences stack in the same direction across consecutive swings, the signal strengthens considerably.
Mã nguồn mở
Theo đúng tinh thần TradingView, tác giả của tập lệnh này đã công bố nó dưới dạng mã nguồn mở, để các nhà giao dịch có thể xem xét và xác minh chức năng. Chúc mừng tác giả! Mặc dù bạn có thể sử dụng miễn phí, hãy nhớ rằng việc công bố lại mã phải tuân theo Nội quy.

Thông báo miễn trừ trách nhiệm
Thông tin và các ấn phẩm này không nhằm mục đích, và không cấu thành, lời khuyên hoặc khuyến nghị về tài chính, đầu tư, giao dịch hay các loại khác do TradingView cung cấp hoặc xác nhận. Đọc thêm tại Điều khoản Sử dụng.
Mã nguồn mở
Theo đúng tinh thần TradingView, tác giả của tập lệnh này đã công bố nó dưới dạng mã nguồn mở, để các nhà giao dịch có thể xem xét và xác minh chức năng. Chúc mừng tác giả! Mặc dù bạn có thể sử dụng miễn phí, hãy nhớ rằng việc công bố lại mã phải tuân theo Nội quy.
Thông báo miễn trừ trách nhiệm
Thông tin và các ấn phẩm này không nhằm mục đích, và không cấu thành, lời khuyên hoặc khuyến nghị về tài chính, đầu tư, giao dịch hay các loại khác do TradingView cung cấp hoặc xác nhận. Đọc thêm tại Điều khoản Sử dụng.