Cập nhật
SMC Market Structure + Price Zones [MaB]
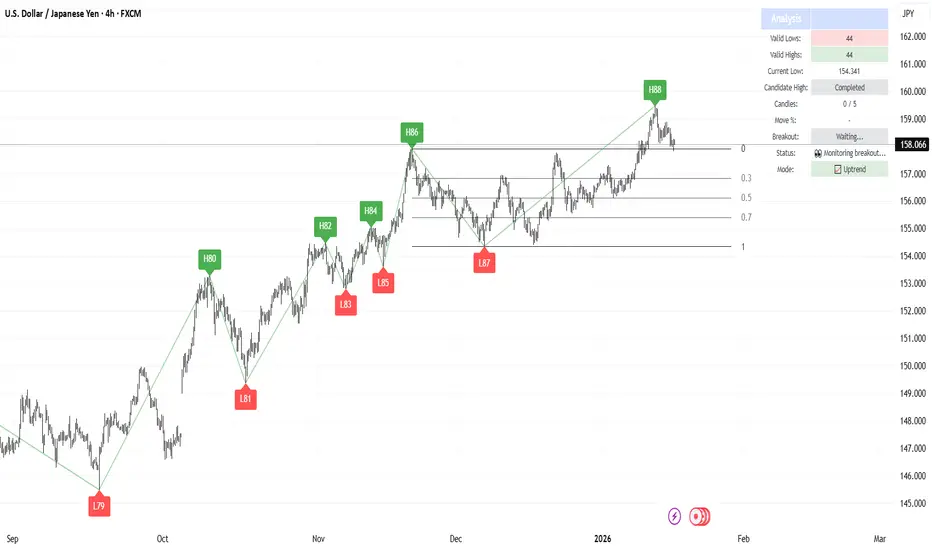
📊 SMC Market Structure + Price Zones [MaB]
A precision market structure indicator that identifies valid swing points using a custom confirmation algorithm, combined with dynamic price zones for retracement analysis.
━━━━━━━━━━━━━━━━━━━━━━━━━━━━━━━━━━━━━━━━
🔬 HOW THE ALGORITHM WORKS
1️⃣ Swing Point Detection Logic
Unlike simple pivot-based indicators, this script uses a custom state machine that tracks price action in real-time:
- Candidate Detection: When price makes a new high, the algorithm waits for a candle to CLOSE below the low of that high candle. This "close below trigger" initiates a candidate state.
- Dual Confirmation System: A candidate becomes a validated swing point only when BOTH conditions are met:
- Time Filter: A minimum number of candles must pass (configurable, default: 5)
- Price Filter: Price must retrace by a minimum percentage of the previous leg's range (configurable, default: 10%)
- Dynamic Threshold Adjustment: When the current leg amplitude exceeds 2.5× the average of the last 20 legs, the algorithm automatically relaxes confirmation filters to avoid missing extended moves.
2️⃣ Trend State Machine
The indicator maintains an internal trend state (Uptrend/Downtrend) that determines how price action is interpreted:
- Uptrend Mode: Searches for Higher Highs (H1, H2, H3...) and Higher Lows (L1, L2, L3...). A confirmed High triggers monitoring for breakout above that level.
- Downtrend Mode: Searches for Lower Highs and Lower Lows. A confirmed Low triggers monitoring for breakdown below that level.
- Trend Inversion: When price closes beyond the opposite structure point by the Breakout Threshold %, the trend state flips and the search pattern reverses.
3️⃣ Price Zones (Retracement Levels)
Once a valid swing point is confirmed, the indicator automatically draws price zones between the protected level (current valid High/Low) and the previous swing point:
- Level 0 (0%): The protected swing level
- Level 0.3 (30%): First retracement level
- Level 0.5 (50%): Mid retracement level
- Level 0.7 (70%): Deep retracement level
- Level 1 (100%): Previous swing level
These levels provide visual reference points for analyzing price behavior during retracements.
━━━━━━━━━━━━━━━━━━━━━━━━━━━━━━━━━━━━━━━━
⚙️ PARAMETERS EXPLAINED
Market Structure
- Min Confirmation Candles (default: 5) — Bars required after candidate detection before validation
- Pullback Percentage (default: 10%) — Minimum retracement of leg range required for confirmation
- Breakout Threshold (default: 5%) — Distance beyond structure level for confirmed breakout
Price Zones
- Level Colors — Customize colors for boundary (0/1) and intermediate (0.3/0.5/0.7) levels
- Line Width — Thickness of zone lines
- Extend Right — How far zones project into the future
Display
- Show Market Structure Table — Displays current state: valid H/L values, breakout status, trend mode
- Dark Theme — Adapts colors for dark chart backgrounds
- Replay Mode — Optimizes for TradingView's replay feature
━━━━━━━━━━━━━━━━━━━━━━━━━━━━━━━━━━━━━━━━
🎨 VISUAL GUIDE
Structure Labels:
- H1, H2, H3... = Confirmed Higher Highs (uptrend)
- L1, L2, L3... = Confirmed Higher Lows (uptrend)
- Labels reset on trend inversion
Structure Lines:
- 🟢 Green = Uptrend leg (L→H movement)
- 🔴 Red = Downtrend leg (H→L movement)
- ⚪ Gray = Trend inversion point
Price Zone Lines:
- Horizontal lines at 0%, 30%, 50%, 70%, 100% retracement
- Updated dynamically as new swing points are confirmed
━━━━━━━━━━━━━━━━━━━━━━━━━━━━━━━━━━━━━━━━
💡 PRACTICAL USAGE
1. Trend Visualization: The colored structure lines help visualize the current market direction — green legs indicate bullish structure, red legs indicate bearish structure.
2. Retracement Analysis: Price zones provide reference levels to observe how price behaves during pullbacks within a trend.
3. Breakout Monitoring: The "Br↑" and "Br↓" labels indicate when price has exceeded a structure level by the configured threshold.
4. Structure Overview: The table provides a quick summary of current valid highs/lows and trend state without needing to scan the entire chart.
⚠️ This indicator is designed as an analytical tool to help visualize market structure. It does not generate buy/sell signals.
━━━━━━━━━━━━━━━━━━━━━━━━━━━━━━━━━━━━━━━━
🔄 WHY THIS IS DIFFERENT
Most market structure indicators use simple pivot highs/lows with fixed lookback periods. This creates:
- False signals during consolidation
- Missed swings during strong trends
- No confirmation of actual breakouts
This indicator addresses these issues with:
✅ Dual confirmation (time + price) before validating any swing
✅ Dynamic threshold adjustment for extended moves
✅ Explicit breakout detection with configurable sensitivity
✅ Automatic price zones for retracement visualization
━━━━━━━━━━━━━━━━━━━━━━━━━━━━━━━━━━━━━━━━
⚠️ NOTES
- Best results on 1H+ timeframes for cleaner structure
- Use Replay Mode when backtesting to prevent buffer errors
- Price zones update automatically when new swings are confirmed
- The table shows real-time structure state for quick reference
━━━━━━━━━━━━━━━━━━━━━━━━━━━━━━━━━━━━━━━━
⚠️ DISCLAIMER
This indicator is for educational and analytical purposes only. It does not constitute financial advice or trading recommendations. Always conduct your own analysis and manage your risk appropriately.
A precision market structure indicator that identifies valid swing points using a custom confirmation algorithm, combined with dynamic price zones for retracement analysis.
━━━━━━━━━━━━━━━━━━━━━━━━━━━━━━━━━━━━━━━━
🔬 HOW THE ALGORITHM WORKS
1️⃣ Swing Point Detection Logic
Unlike simple pivot-based indicators, this script uses a custom state machine that tracks price action in real-time:
- Candidate Detection: When price makes a new high, the algorithm waits for a candle to CLOSE below the low of that high candle. This "close below trigger" initiates a candidate state.
- Dual Confirmation System: A candidate becomes a validated swing point only when BOTH conditions are met:
- Time Filter: A minimum number of candles must pass (configurable, default: 5)
- Price Filter: Price must retrace by a minimum percentage of the previous leg's range (configurable, default: 10%)
- Dynamic Threshold Adjustment: When the current leg amplitude exceeds 2.5× the average of the last 20 legs, the algorithm automatically relaxes confirmation filters to avoid missing extended moves.
2️⃣ Trend State Machine
The indicator maintains an internal trend state (Uptrend/Downtrend) that determines how price action is interpreted:
- Uptrend Mode: Searches for Higher Highs (H1, H2, H3...) and Higher Lows (L1, L2, L3...). A confirmed High triggers monitoring for breakout above that level.
- Downtrend Mode: Searches for Lower Highs and Lower Lows. A confirmed Low triggers monitoring for breakdown below that level.
- Trend Inversion: When price closes beyond the opposite structure point by the Breakout Threshold %, the trend state flips and the search pattern reverses.
3️⃣ Price Zones (Retracement Levels)
Once a valid swing point is confirmed, the indicator automatically draws price zones between the protected level (current valid High/Low) and the previous swing point:
- Level 0 (0%): The protected swing level
- Level 0.3 (30%): First retracement level
- Level 0.5 (50%): Mid retracement level
- Level 0.7 (70%): Deep retracement level
- Level 1 (100%): Previous swing level
These levels provide visual reference points for analyzing price behavior during retracements.
━━━━━━━━━━━━━━━━━━━━━━━━━━━━━━━━━━━━━━━━
⚙️ PARAMETERS EXPLAINED
Market Structure
- Min Confirmation Candles (default: 5) — Bars required after candidate detection before validation
- Pullback Percentage (default: 10%) — Minimum retracement of leg range required for confirmation
- Breakout Threshold (default: 5%) — Distance beyond structure level for confirmed breakout
Price Zones
- Level Colors — Customize colors for boundary (0/1) and intermediate (0.3/0.5/0.7) levels
- Line Width — Thickness of zone lines
- Extend Right — How far zones project into the future
Display
- Show Market Structure Table — Displays current state: valid H/L values, breakout status, trend mode
- Dark Theme — Adapts colors for dark chart backgrounds
- Replay Mode — Optimizes for TradingView's replay feature
━━━━━━━━━━━━━━━━━━━━━━━━━━━━━━━━━━━━━━━━
🎨 VISUAL GUIDE
Structure Labels:
- H1, H2, H3... = Confirmed Higher Highs (uptrend)
- L1, L2, L3... = Confirmed Higher Lows (uptrend)
- Labels reset on trend inversion
Structure Lines:
- 🟢 Green = Uptrend leg (L→H movement)
- 🔴 Red = Downtrend leg (H→L movement)
- ⚪ Gray = Trend inversion point
Price Zone Lines:
- Horizontal lines at 0%, 30%, 50%, 70%, 100% retracement
- Updated dynamically as new swing points are confirmed
━━━━━━━━━━━━━━━━━━━━━━━━━━━━━━━━━━━━━━━━
💡 PRACTICAL USAGE
1. Trend Visualization: The colored structure lines help visualize the current market direction — green legs indicate bullish structure, red legs indicate bearish structure.
2. Retracement Analysis: Price zones provide reference levels to observe how price behaves during pullbacks within a trend.
3. Breakout Monitoring: The "Br↑" and "Br↓" labels indicate when price has exceeded a structure level by the configured threshold.
4. Structure Overview: The table provides a quick summary of current valid highs/lows and trend state without needing to scan the entire chart.
⚠️ This indicator is designed as an analytical tool to help visualize market structure. It does not generate buy/sell signals.
━━━━━━━━━━━━━━━━━━━━━━━━━━━━━━━━━━━━━━━━
🔄 WHY THIS IS DIFFERENT
Most market structure indicators use simple pivot highs/lows with fixed lookback periods. This creates:
- False signals during consolidation
- Missed swings during strong trends
- No confirmation of actual breakouts
This indicator addresses these issues with:
✅ Dual confirmation (time + price) before validating any swing
✅ Dynamic threshold adjustment for extended moves
✅ Explicit breakout detection with configurable sensitivity
✅ Automatic price zones for retracement visualization
━━━━━━━━━━━━━━━━━━━━━━━━━━━━━━━━━━━━━━━━
⚠️ NOTES
- Best results on 1H+ timeframes for cleaner structure
- Use Replay Mode when backtesting to prevent buffer errors
- Price zones update automatically when new swings are confirmed
- The table shows real-time structure state for quick reference
━━━━━━━━━━━━━━━━━━━━━━━━━━━━━━━━━━━━━━━━
⚠️ DISCLAIMER
This indicator is for educational and analytical purposes only. It does not constitute financial advice or trading recommendations. Always conduct your own analysis and manage your risk appropriately.
Phát hành các Ghi chú
Fixed Issues1. Breakdown Detection During High Validation
Bug: When price broke below the protected low while a high candidate was being validated, the breakdown was not detected
Fix: The system now correctly detects breakdown during candidate validation phase, properly validates both the low and high points, then triggers the trend reversal
2. Breakup Detection During Low Validation
Bug: When price broke above the protected high while a low candidate was being validated, the breakup was not detected
Fix: The system now correctly detects breakup during candidate validation phase, properly validates both the high and low points, then triggers the trend reversal
Phát hành các Ghi chú
Re-Edit of last updateFixed all the issues of breakouts during confirmation high/low state
Phát hành các Ghi chú
Update Notes - Inversion During Validation FixBug Fixed:
When a trend inversion occurred during the validation phase of a swing point (not after confirmation), the algorithm would incorrectly handle the transition. This caused:
Immediate confirmation of both L and H points without proper validation
Status getting stuck in "Searching swing low" when it should switch to monitoring for a new high
Fibonacci zone levels (0/1) not inverting correctly for the new trend direction
Solution:
Added dedicated logic to handle breakup during low validation and breakdown during high validation. The fix now:
Properly confirms the pending candidate point
Checks for duplicate points before adding to arrays
Correctly resets all state variables for the new trend direction
Creates the Fibonacci zone with proper orientation
Resumes normal validation cycle for the next swing point
Phát hành các Ghi chú
Update Notes - Dark Mode FixAuto Dark Mode Detection
The indicator now automatically detects your chart's background color and adjusts all visual elements accordingly. No manual toggle needed.
What's fixed:
Table text now properly switches to white on dark backgrounds
Fibonacci zone lines (0 and 1 levels) automatically adjust for visibility
Extension rate lines and labels now visible on dark themes
Removed manual "Dark Theme" toggle - detection is now automatic
How it works:
The indicator analyzes your chart's background brightness. On dark backgrounds, all text and key lines switch to white. On light backgrounds, they remain black.
Option available:
"Auto Dark Mode" (ON by default): Automatic detection
If disabled: Forces white text/lines (useful if auto-detection doesn't work for your setup)
Phát hành các Ghi chú
🔧 Bug Fixes- Fixed runtime crash on long chart histories
Resolved an error ("bar index too far from current bar") that caused the indicator to crash when the last confirmed swing high or low was too far back from the current bar. This typically occurred on lower timeframes with extended chart data. Price zone lines now draw correctly regardless of how far back the reference swing point is, with zero visual impact on the chart.
- Fixed "Show Market Structure" toggle not working
The toggle now properly controls all visual elements: swing labels (L1, H1, L2…), trend lines, and invalidation markers (✗). Previously, these elements remained visible even when the setting was turned off.
📊 Changes
- Default analysis start date changed from 2024-01-01 to 2000-01-01 to include full historical data by default.
Phát hành các Ghi chú
🔧 Bug Fixes- Fixed runtime crash on long chart histories
Resolved an error ("bar index too far from current bar") that caused the indicator to crash when the last confirmed swing high or low was too far back from the current bar. This typically occurred on lower timeframes with extended chart data. All drawing functions are now protected with a safety clamp, with zero visual impact on the chart.
- Fixed "Show Market Structure" toggle not working
The toggle now properly controls all visual elements: swing labels (L1, H1, L2…), trend lines, and invalidation markers (✗). Previously, these elements remained visible even when the setting was turned off.
📊 Changes
- Default analysis start date changed from 2024-01-01 to 2000-01-01 to include full historical data by default.
Phát hành các Ghi chú
🔧 Bug Fix- Fixed state machine getting stuck after data gaps
The indicator now detects missing candles (gaps in data caused by broker outages, weekend gaps, or TradingView data issues) and performs a soft reset of the state machine. All previously confirmed structural points are preserved — only the active tracking state is reset so the engine can resume analysis cleanly from the first available candle after the gap. This prevents the indicator from getting stuck in an intermediate state and failing to detect subsequent breakouts.
Phát hành các Ghi chú
🔧 Bug Fix- Improved data gap recovery (replaces previous fix)
The previous update introduced a time-based gap detector that could trigger incorrectly on normal market closures (weekends, overnight gaps), causing the state machine to reset unnecessarily. This has been replaced with a price-based state coherence check: the engine now detects when its internal state is incoherent with the current price level (e.g. a missed breakout) and only then performs a soft reset. All previously confirmed structural points are always preserved. This approach is more robust and works regardless of the cause — data gaps, single extreme candles, or any other anomaly.
Phát hành các Ghi chú
🔧 Bug Fixes- Fixed state machine getting stuck after breakout/breakdown
After a breakout or breakdown, the state machine could get stuck and fail to validate the next swing point. The issue was caused by incorrect initialization of tracking variables at the transition: the engine now uses the actual high/low of the breakout candle as the starting reference (instead of the close), and immediately activates the validation mechanism so the candidate swing point can be detected from the very next candle.
- Added data gap recovery system
The indicator now detects missing candles in the data (caused by broker outages or data feed issues) and performs a soft reset only when: a time gap is detected, it's not a weekend closure, and the price has moved outside the last confirmed structural range. All previously confirmed structural points are preserved — only the active tracking state is reset so the engine can resume clean analysis.
Phát hành các Ghi chú
🔧 Bug FixesFixed breakdown/breakup detection during candidate validation
Strong moves that caused a breakdown or breakup while a swing point was being validated were sometimes ignored. Now correctly detected in all cases.
Phát hành các Ghi chú
🔧 Bug Fix- Fixed data gap recovery triggering during candidate validation
The gap recovery system could incorrectly reset the engine when a time gap occurred while validating a swing point, causing false breakdowns. It now only activates during the monitoring breakout phase, allowing candidate validation to continue normally after gaps.
Phát hành các Ghi chú
🔧 Fix- Updated default parameters
Required Pullback Percentage default changed from 10% to 20%. No changes to indicator logic.

Trading indicators development focused on Smart Money Concepts (SMC), market structure analysis, and liquidity zones.
WEBSITE: mab-arreca.com/
WHOP: whop.com/mab-9cb1/
YOUTUBE: youtube.com/@MaB.arreca
WEBSITE: mab-arreca.com/
WHOP: whop.com/mab-9cb1/
YOUTUBE: youtube.com/@MaB.arreca
Thông báo miễn trừ trách nhiệm
Thông tin và các ấn phẩm này không nhằm mục đích, và không cấu thành, lời khuyên hoặc khuyến nghị về tài chính, đầu tư, giao dịch hay các loại khác do TradingView cung cấp hoặc xác nhận. Đọc thêm tại Điều khoản Sử dụng.
Trading indicators development focused on Smart Money Concepts (SMC), market structure analysis, and liquidity zones.
WEBSITE: mab-arreca.com/
WHOP: whop.com/mab-9cb1/
YOUTUBE: youtube.com/@MaB.arreca
WEBSITE: mab-arreca.com/
WHOP: whop.com/mab-9cb1/
YOUTUBE: youtube.com/@MaB.arreca
Thông báo miễn trừ trách nhiệm
Thông tin và các ấn phẩm này không nhằm mục đích, và không cấu thành, lời khuyên hoặc khuyến nghị về tài chính, đầu tư, giao dịch hay các loại khác do TradingView cung cấp hoặc xác nhận. Đọc thêm tại Điều khoản Sử dụng.