OPEN-SOURCE SCRIPT
Daily Cloud Roadmap by TenAMTrader
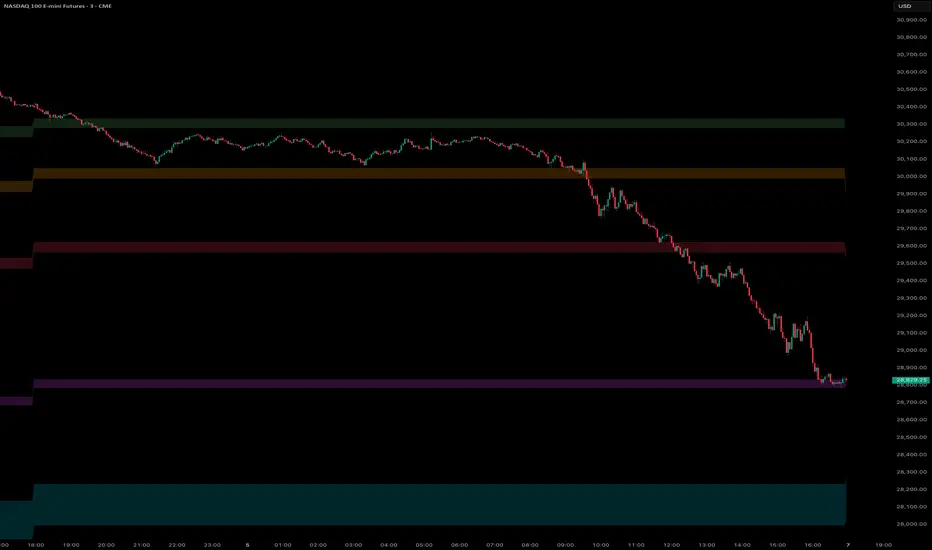
Daily Cloud Roadmap by TenAMTrader
The Daily Cloud Roadmap is a multi-layer EMA cloud indicator designed to help intraday traders navigate price action using daily exponential moving average structure. Rather than plotting single EMA lines, each cloud is formed by a pair of EMAs, giving you a zone of confluence instead of a hard line — making it easier to read where price is relative to key daily levels, regardless of what timeframe you're trading on.
Five cloud layers are included by default:
Cloud 1: 8/9 EMA (short-term momentum)
Cloud 2: 13/14 EMA (near-term trend)
Cloud 3: 20/21 EMA (intermediate trend)
Cloud 4: 34/35 EMA (medium-term structure)
Cloud 5: 48/55 EMA (longer-term structure)
Each cloud changes color dynamically based on whether the shorter EMA is above or below the longer EMA, giving an at-a-glance read on the trend state of each layer. All periods, colors, and timeframes are fully customizable.
Additional features include:
Configurable EMA source and timeframe (defaults to Daily)
Optional EMA lines on top of each cloud
Optional ATR-based TP/SL bands anchored to any EMA
Optional smoothing for cleaner visuals on lower timeframes
How to use it:
Load it on any intraday chart — 1m, 5m, 15m, etc. — and the clouds will reflect the daily EMA levels, giving you a roadmap of where the significant daily structure sits as you trade intraday. Look for reactions at cloud edges, confluences between cloud layers, and color shifts as potential areas of interest.
⚠️ Disclaimer:
This indicator is provided for educational and informational purposes only. It does not constitute financial advice, investment advice, or a recommendation to buy or sell any security or financial instrument. Past performance of any trading strategy or methodology is not indicative of future results. Trading involves substantial risk of loss and is not suitable for all investors. You are solely responsible for your own trading decisions. TenAMTrader and the developer of this script accept no liability for any losses incurred as a result of using this indicator. Always conduct your own due diligence and consult a licensed financial advisor before making any trading decisions.
Mã nguồn mở
Theo đúng tinh thần TradingView, tác giả của tập lệnh này đã công bố nó dưới dạng mã nguồn mở, để các nhà giao dịch có thể xem xét và xác minh chức năng. Chúc mừng tác giả! Mặc dù bạn có thể sử dụng miễn phí, hãy nhớ rằng việc công bố lại mã phải tuân theo Nội quy.

Thông báo miễn trừ trách nhiệm
Thông tin và các ấn phẩm này không nhằm mục đích, và không cấu thành, lời khuyên hoặc khuyến nghị về tài chính, đầu tư, giao dịch hay các loại khác do TradingView cung cấp hoặc xác nhận. Đọc thêm tại Điều khoản Sử dụng.
Mã nguồn mở
Theo đúng tinh thần TradingView, tác giả của tập lệnh này đã công bố nó dưới dạng mã nguồn mở, để các nhà giao dịch có thể xem xét và xác minh chức năng. Chúc mừng tác giả! Mặc dù bạn có thể sử dụng miễn phí, hãy nhớ rằng việc công bố lại mã phải tuân theo Nội quy.
Thông báo miễn trừ trách nhiệm
Thông tin và các ấn phẩm này không nhằm mục đích, và không cấu thành, lời khuyên hoặc khuyến nghị về tài chính, đầu tư, giao dịch hay các loại khác do TradingView cung cấp hoặc xác nhận. Đọc thêm tại Điều khoản Sử dụng.