Saturation Peak Detection [PhenLabs]
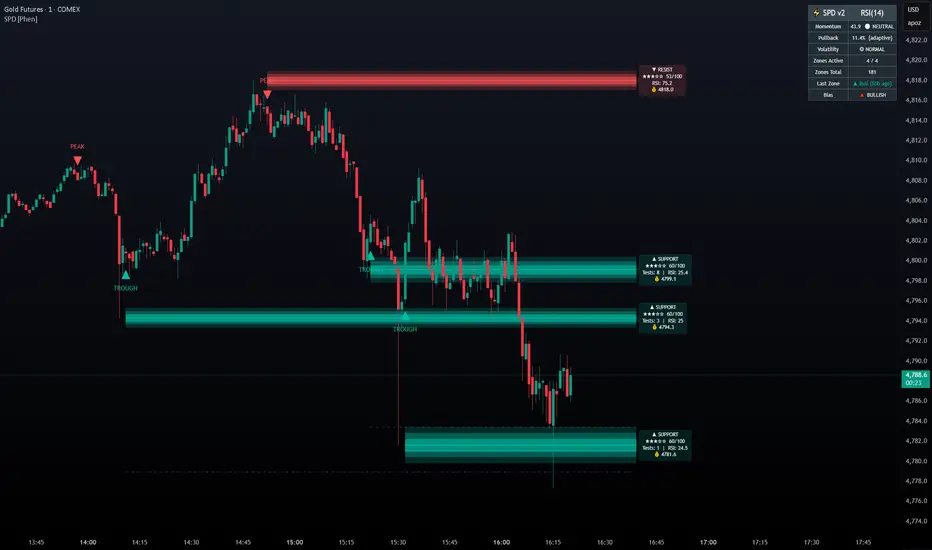
📊 Saturation Peak Detection [PhenLabs]
v1.0 — S/R zones planted only when momentum peaks and pulls back — no sweep noise, only saturation-confirmed structure

📌 OVERVIEW
Saturation Peak Detection (SPD) plants support and resistance zones only at price levels where a momentum proxy has demonstrably exhausted. Most S/R tools mark every swing pivot — SPD adds a mandatory saturation gate: a zone only forms when the momentum proxy (RSI, ROC, or MFI) has peaked within a lookback window and then pulled back by a configurable % from that peak. If momentum hasn’t saturated, no zone is drawn.
The result is a smaller set of higher-conviction structural levels, each backed by a quantifiable momentum exhaustion event — easier to audit, easier to trust.
HOW IT WORKS
* Rolling Peak and Trough Tracking
* Saturation Trigger
* Latch + Cooldown System
* Zone Management
🔑 POINTS OF INNOVATION
🔧 SETTINGS
Momentum Proxy
Saturation Trigger
Zone Settings
Display
Colors
🔥 ALERTS
🎨 VISUAL GUIDE
📖 USAGE NOTES
✅ WORKS WELL WITH
v1.0 — S/R zones planted only when momentum peaks and pulls back — no sweep noise, only saturation-confirmed structure
📌 OVERVIEW
Saturation Peak Detection (SPD) plants support and resistance zones only at price levels where a momentum proxy has demonstrably exhausted. Most S/R tools mark every swing pivot — SPD adds a mandatory saturation gate: a zone only forms when the momentum proxy (RSI, ROC, or MFI) has peaked within a lookback window and then pulled back by a configurable % from that peak. If momentum hasn’t saturated, no zone is drawn.
The result is a smaller set of higher-conviction structural levels, each backed by a quantifiable momentum exhaustion event — easier to audit, easier to trust.
HOW IT WORKS
- Momentum Proxy Computation
- Choose RSI, ROC (Rate of Change), or MFI (Money Flow Index) — all standard, public-domain oscillators
- The selected proxy is computed over a configurable length (default: 14 bars)
- An optional second-pane plot shows the raw momentum series, rolling peak, and rolling trough for visual reference
* Rolling Peak and Trough Tracking
- Rolling peak: highest momentum value within the last N bars (configurable Peak Lookback)
- Rolling trough: lowest momentum value within the same window
- The price at the bar of the peak/trough is stored as the zone anchor
* Saturation Trigger
- Bear saturation: momentum drops ≥ Pullback % below its rolling peak → resistance zone planted at the peak-bar’s price
- Bull saturation: momentum recovers ≥ Pullback % above its rolling trough → support zone planted at the trough-bar’s price
- All triggers gated on barstate.isconfirmed — no intrabar firing, no repainting
* Latch + Cooldown System
- Each unique peak/trough can only create one zone — the latch tracks the bar index of the last-used peak/trough and blocks a re-trigger on the same event
- A configurable Zone Cooldown (default: 10 bars) enforces a minimum spacing between any two zone creations
- Together these prevent consecutive-bar spam and cluster stacking
* Zone Management
- Each zone is an ATR-wide filled rectangle centered on the anchor price — context-relative thickness
- A dashed invalidation line sits at a configurable offset beyond the zone boundary
- When price closes past the invalidation line, the zone is greyed out (non-destructive — stays visible for audit)
- Maximum active zones cap (default: 3) with oldest-valid-first eviction
🔑 POINTS OF INNOVATION
- Saturation gate: zones require quantified momentum exhaustion, not just a price pivot — fundamentally different from standard S/R tools
- Three interchangeable proxies: RSI, ROC, MFI — swap based on market type (RSI for equities/crypto, ROC for pure momentum, MFI for volume-heavy instruments)
- Peak-price anchoring: the zone is planted at the price of the momentum peak bar, not the trigger bar — precise anchor to where buyers/sellers actually exhausted
- Single-concept extractability: clean, auditable logic with one mechanism — easy to backtest, explain, and extend
- Non-destructive invalidation: invalidated zones stay visible in grey, preserving historical structure context without cluttering the active signal layer
🔧 SETTINGS
Momentum Proxy
- Momentum Source | Default: RSI | Options: RSI, ROC, MFI
- Momentum Length | Default: 14 | Range: 2–100
- Peak Lookback (bars) | Default: 50 | Range: 5–300 | Window for detecting rolling peak/trough
Saturation Trigger
- Pullback % from Peak | Default: 10.0 | Range: 1.0–50.0 | Momentum must pull back this % to confirm saturation. Higher = rarer, stronger zones
- Zone Cooldown (bars) | Default: 10 | Range: 0–100 | Minimum bars between zone creations
Zone Settings
- Max Active Zones | Default: 3 | Range: 1–10
- ATR Length | Default: 14 | Used to compute zone height
- Invalidation Offset (%) | Default: 0.3 | Zone is invalidated when price closes this % beyond the outer boundary
Display
- Show Momentum Line (Pane 2) | Default: ON | Plots momentum proxy + rolling peak/trough in a separate pane
- Show Zone Labels | Default: ON | Labels show zone type and momentum value at peak
Colors
- Support Zone, Resistance Zone, Invalidation Line, Trigger Marker — all fully customizable
🔥 ALERTS
- SPD — Bear Saturation Zone: fires when a resistance zone is planted (momentum peaked, pullback confirmed)
- SPD — Bull Saturation Zone: fires when a support zone is planted (momentum troughed, recovery confirmed)
🎨 VISUAL GUIDE
- Teal filled rectangle = active support zone (bull saturation confirmed)
- Red filled rectangle = active resistance zone (bear saturation confirmed)
- Grey filled rectangle = invalidated zone (price closed beyond invalidation line)
- Dashed grey line = invalidation level for each zone
- Orange triangles = saturation trigger markers (▲ below bar = bull, ▼ above bar = bear)
- Purple line (pane 2) = raw momentum proxy
- Red step line (pane 2) = rolling peak | Teal step line (pane 2) = rolling trough
📖 USAGE NOTES
- Designed for 1H, 4H, and Daily timeframes — where momentum exhaustion is most structurally significant
- RSI works best on equities and crypto where overbought/oversold levels are well-studied
- ROC is better for pure price momentum without smoothing — use on trending futures and forex pairs
- MFI adds volume confirmation — best on high-volume instruments where volume leads price
- Increase Pullback % to 15–20% for fewer, higher-conviction zones; reduce to 5–8% for more frequent signals on lower timeframes
- The zone anchor is the price at the momentum peak bar — this is the level where participants exhausted, not the trigger bar
- Use the dashed invalidation line as a hard stop reference — a close beyond it means the zone has been absorbed
✅ WORKS WELL WITH
- Volume Profile tools (confirm zone with high-volume nodes)
- VWAP / Anchored VWAP (zone + VWAP confluence = stronger level)
- Trend filters (EMA, Supertrend) for directional bias before entering at a zone
- ATR-based position sizing (zone width already ATR-scaled — align stop to invalidation line)
⚠️ DISCLAIMER
This indicator is for educational and research purposes only. It is not financial advice and does not constitute a trading recommendation. Past performance does not guarantee future results. Always conduct your own analysis before making any trading or investment decision.

TradingView Charting w/ Crypto Systems: phenlabs.com
Join our growing community: discord.gg/phen
All content provided by PhenLabs is for informational & educational purposes only. Past performance does not guarantee future results.
Join our growing community: discord.gg/phen
All content provided by PhenLabs is for informational & educational purposes only. Past performance does not guarantee future results.
Thông báo miễn trừ trách nhiệm
Thông tin và các ấn phẩm này không nhằm mục đích, và không cấu thành, lời khuyên hoặc khuyến nghị về tài chính, đầu tư, giao dịch hay các loại khác do TradingView cung cấp hoặc xác nhận. Đọc thêm tại Điều khoản Sử dụng.
TradingView Charting w/ Crypto Systems: phenlabs.com
Join our growing community: discord.gg/phen
All content provided by PhenLabs is for informational & educational purposes only. Past performance does not guarantee future results.
Join our growing community: discord.gg/phen
All content provided by PhenLabs is for informational & educational purposes only. Past performance does not guarantee future results.
Thông báo miễn trừ trách nhiệm
Thông tin và các ấn phẩm này không nhằm mục đích, và không cấu thành, lời khuyên hoặc khuyến nghị về tài chính, đầu tư, giao dịch hay các loại khác do TradingView cung cấp hoặc xác nhận. Đọc thêm tại Điều khoản Sử dụng.