Amari's Killzone Timings
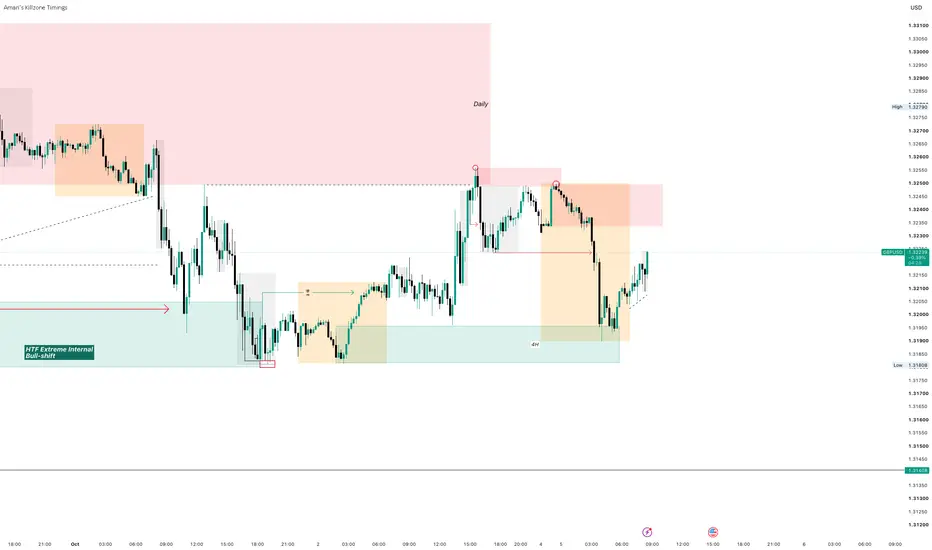
Kill Zone Timings where the banks make their main moves
See the market’s key trading windows at a glance.
Stop wasting time manually tracking session times. ICT Kill Zone Boxes automatically highlights the key liquidity windows on your chart, giving you a clean visual reference for where important intraday price action may develop.
🎯 Four Key Sessions
The indicator automatically marks:
🔵 Asia — 10:00 PM to 7:00 AM
🟠 London — 8:00 AM to 9:00 AM
🔴 New York — 2:00 PM to 3:00 PM
🟣 London Close — 4:00 PM to 8:00 PM
Each session is displayed as a clean, transparent box that tracks the high and low formed during the session, making the range immediately visible without cluttering your chart.
⚡ Designed for Clean Charts
No unnecessary lines. No distracting borders. No complicated settings.
The boxes are intentionally minimal so you can keep your focus on price action, liquidity, and market structure.
The indicator also automatically hides itself when you switch to Daily or higher timeframes, keeping your higher-timeframe analysis clean.
🧠 Built for Intraday Traders & Swing Traders
Whether you're trading liquidity sweeps, session highs and lows, breakouts, reversals, or ICT/SMC-style setups, having the major trading windows clearly marked can help you understand when and where price is moving.
Know the session. Know the range. Read the reaction.
A cleaner way to visualise the market's most important intraday windows.
Disclaimer: This indicator is a charting and visualisation tool and does not provide financial advice or guarantee trading results.
See the market’s key trading windows at a glance.
Stop wasting time manually tracking session times. ICT Kill Zone Boxes automatically highlights the key liquidity windows on your chart, giving you a clean visual reference for where important intraday price action may develop.
🎯 Four Key Sessions
The indicator automatically marks:
🔵 Asia — 10:00 PM to 7:00 AM
🟠 London — 8:00 AM to 9:00 AM
🔴 New York — 2:00 PM to 3:00 PM
🟣 London Close — 4:00 PM to 8:00 PM
Each session is displayed as a clean, transparent box that tracks the high and low formed during the session, making the range immediately visible without cluttering your chart.
⚡ Designed for Clean Charts
No unnecessary lines. No distracting borders. No complicated settings.
The boxes are intentionally minimal so you can keep your focus on price action, liquidity, and market structure.
The indicator also automatically hides itself when you switch to Daily or higher timeframes, keeping your higher-timeframe analysis clean.
🧠 Built for Intraday Traders & Swing Traders
Whether you're trading liquidity sweeps, session highs and lows, breakouts, reversals, or ICT/SMC-style setups, having the major trading windows clearly marked can help you understand when and where price is moving.
Know the session. Know the range. Read the reaction.
A cleaner way to visualise the market's most important intraday windows.
Disclaimer: This indicator is a charting and visualisation tool and does not provide financial advice or guarantee trading results.

Thông báo miễn trừ trách nhiệm
Thông tin và các ấn phẩm này không nhằm mục đích, và không cấu thành, lời khuyên hoặc khuyến nghị về tài chính, đầu tư, giao dịch hay các loại khác do TradingView cung cấp hoặc xác nhận. Đọc thêm tại Điều khoản Sử dụng.
Thông báo miễn trừ trách nhiệm
Thông tin và các ấn phẩm này không nhằm mục đích, và không cấu thành, lời khuyên hoặc khuyến nghị về tài chính, đầu tư, giao dịch hay các loại khác do TradingView cung cấp hoặc xác nhận. Đọc thêm tại Điều khoản Sử dụng.