OPEN-SOURCE SCRIPT
RSI(5) on RSI(14)
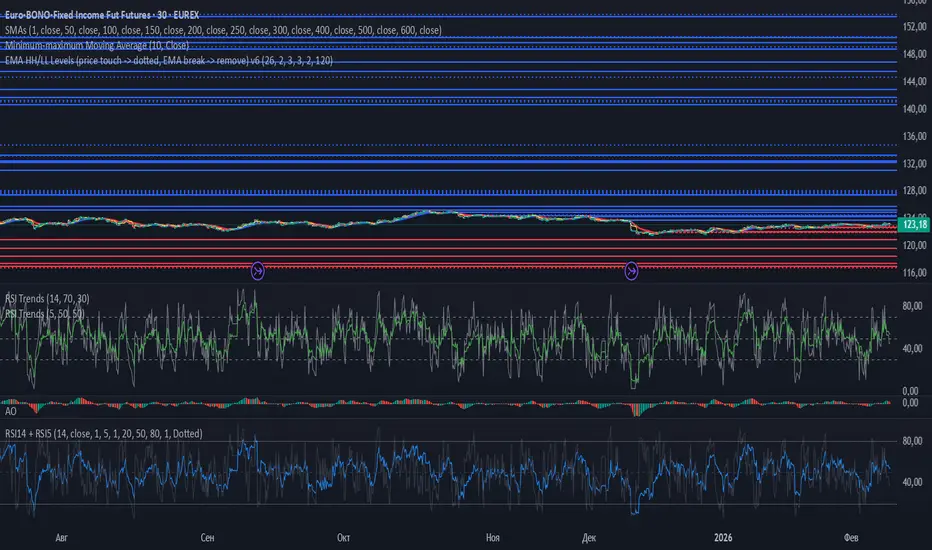
RSI(5) on RSI(14)
This indicator is displayed in a separate pane and works on all timeframes.
It combines a classic RSI with a secondary RSI calculated on the RSI values themselves, allowing deeper analysis of momentum and internal strength.
Indicator Logic
The indicator consists of two components:
RSI (period 14) calculated from price data (default: Close).
RSI (period 5) calculated on the values of RSI(14), equivalent to Previous Indicator’s Data in MetaTrader.
This structure helps to:
identify overbought and oversold zones using the primary RSI,
observe acceleration, deceleration, and momentum shifts inside the RSI itself using the secondary RSI.
Visualization
RSI(14) is plotted as a configurable colored line.
RSI(5) on RSI(14) is plotted as a thin black line on top of the main RSI.
The indicator scale is fixed between 0 and 100.
Levels
20 and 80 — configurable oversold and overbought levels:
adjustable values,
customizable color,
line width,
line style (solid, dashed, dotted).
50 level:
black,
thin,
dashed,
acts as a mid-level equilibrium reference.
Inputs
Users can adjust:
RSI(14) period,
RSI(5) period,
price source for RSI(14),
colors and line widths,
level values and styles for 20 / 80.
Use Cases
This indicator can be used for:
momentum and strength analysis,
detecting internal RSI momentum shifts,
trend confirmation and filtering,
standalone oscillator analysis or as part of a larger trading system.
This indicator is displayed in a separate pane and works on all timeframes.
It combines a classic RSI with a secondary RSI calculated on the RSI values themselves, allowing deeper analysis of momentum and internal strength.
Indicator Logic
The indicator consists of two components:
RSI (period 14) calculated from price data (default: Close).
RSI (period 5) calculated on the values of RSI(14), equivalent to Previous Indicator’s Data in MetaTrader.
This structure helps to:
identify overbought and oversold zones using the primary RSI,
observe acceleration, deceleration, and momentum shifts inside the RSI itself using the secondary RSI.
Visualization
RSI(14) is plotted as a configurable colored line.
RSI(5) on RSI(14) is plotted as a thin black line on top of the main RSI.
The indicator scale is fixed between 0 and 100.
Levels
20 and 80 — configurable oversold and overbought levels:
adjustable values,
customizable color,
line width,
line style (solid, dashed, dotted).
50 level:
black,
thin,
dashed,
acts as a mid-level equilibrium reference.
Inputs
Users can adjust:
RSI(14) period,
RSI(5) period,
price source for RSI(14),
colors and line widths,
level values and styles for 20 / 80.
Use Cases
This indicator can be used for:
momentum and strength analysis,
detecting internal RSI momentum shifts,
trend confirmation and filtering,
standalone oscillator analysis or as part of a larger trading system.
Mã nguồn mở
Theo đúng tinh thần TradingView, tác giả của tập lệnh này đã công bố nó dưới dạng mã nguồn mở, để các nhà giao dịch có thể xem xét và xác minh chức năng. Chúc mừng tác giả! Mặc dù bạn có thể sử dụng miễn phí, hãy nhớ rằng việc công bố lại mã phải tuân theo Nội quy.

Thông báo miễn trừ trách nhiệm
Thông tin và các ấn phẩm này không nhằm mục đích, và không cấu thành, lời khuyên hoặc khuyến nghị về tài chính, đầu tư, giao dịch hay các loại khác do TradingView cung cấp hoặc xác nhận. Đọc thêm tại Điều khoản Sử dụng.
Mã nguồn mở
Theo đúng tinh thần TradingView, tác giả của tập lệnh này đã công bố nó dưới dạng mã nguồn mở, để các nhà giao dịch có thể xem xét và xác minh chức năng. Chúc mừng tác giả! Mặc dù bạn có thể sử dụng miễn phí, hãy nhớ rằng việc công bố lại mã phải tuân theo Nội quy.
Thông báo miễn trừ trách nhiệm
Thông tin và các ấn phẩm này không nhằm mục đích, và không cấu thành, lời khuyên hoặc khuyến nghị về tài chính, đầu tư, giao dịch hay các loại khác do TradingView cung cấp hoặc xác nhận. Đọc thêm tại Điều khoản Sử dụng.