OPEN-SOURCE SCRIPT
Hilega-Milega BUY SELL Signals
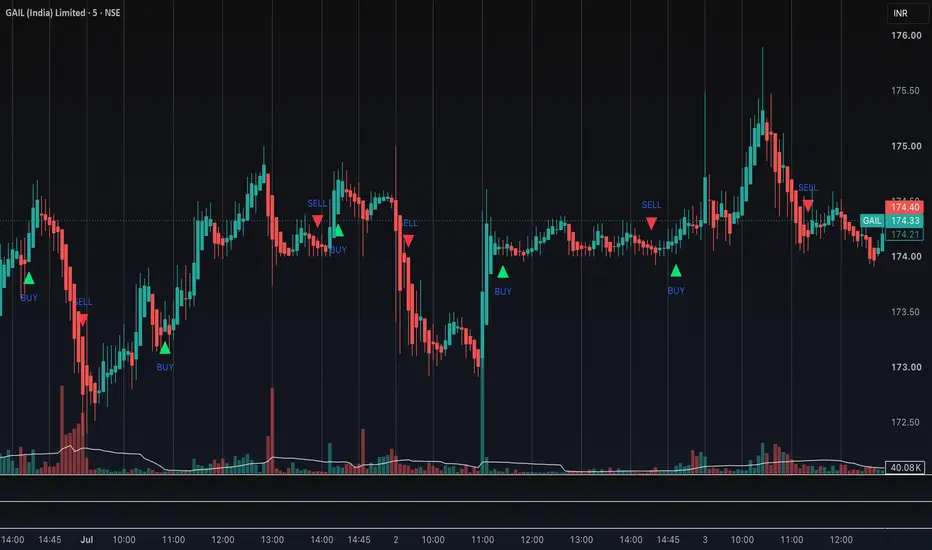
# Hilega-Milega BUY SELL Signals
## Overview
Hilega-Milega BUY SELL Signals is a momentum-based indicator built on the Relative Strength Index (RSI). It combines the RSI with a fast Exponential Moving Average (EMA) and a slow Weighted Moving Average (WMA) to identify potential bullish and bearish trend changes.
The indicator is designed to help traders identify high-probability intraday trading opportunities by filtering signals with both momentum and trend confirmation.
---
## How the Indicator Works
### 1. RSI (Relative Strength Index)
The indicator first calculates a 9-period RSI from the selected price source.
* RSI above 50 indicates bullish momentum.
* RSI below 50 indicates bearish momentum.
The 50 level acts as the primary trend filter.
---
### 2. EMA (3) of RSI
A 3-period Exponential Moving Average is applied to the RSI.
The EMA reacts quickly to changes in momentum and represents the short-term direction of the RSI.
---
### 3. WMA (21) of RSI
A 21-period Weighted Moving Average is also applied to the RSI.
The WMA moves more slowly than the EMA and represents the broader momentum trend.
---
### 4. RSI Background Color
The indicator colors the RSI area to provide quick visual confirmation of trend direction.
* **Red Background:** RSI is above 50 (Bullish Momentum)
* **Aqua Background:** RSI is below 50 (Bearish Momentum)
This allows traders to identify the prevailing momentum at a glance.
---
## Buy Signal
A BUY signal is generated only when all of the following conditions are satisfied:
* The 21-period WMA crosses above the RSI 50 level.
* The 3-period EMA is above the 21-period WMA.
* The RSI is above 50.
This combination indicates that both short-term and medium-term momentum have aligned in the bullish direction.
A BUY label is displayed on the chart when these conditions occur.
---
## Sell Signal
A SELL signal is generated only when all of the following conditions are satisfied:
* The 21-period WMA crosses below the RSI 50 level.
* The 3-period EMA is below the 21-period WMA.
* The RSI is below 50.
This indicates that bearish momentum has been confirmed.
A SELL label is displayed on the chart when these conditions occur.
---
## Alerts
The indicator provides TradingView alert conditions for both BUY and SELL signals.
These alerts can be used for:
* Pop-up notifications
* Mobile notifications
* Email alerts
* Webhook automation
---
## Recommended Timeframes
This indicator works on multiple timeframes, including:
* 3 Minute
* 5 Minute
* 15 Minute
* 30 Minute
* 1 Hour
It is particularly useful for intraday trading.
---
## Recommended Markets
The indicator can be used on:
* Stocks
* Index Futures
* Index Options
* ETFs
* Forex
* Commodities
* Cryptocurrencies
---
## Best Practice
For improved trade quality, use this indicator together with:
* Support and Resistance
* Volume Analysis
* VWAP
* Higher Timeframe Trend
* Risk Management
Avoid taking trades solely based on a single signal.
---
## Disclaimer
This indicator is designed by NK Sir as a technical analysis tool and should not be considered financial or investment advice. I Just Added BUY ,SELL Signals For Educational Purpose only .Please Add Hilega -Milega Indicator below your Chart to confirm Signals . Always perform your own analysis and use appropriate risk management before entering any trade.
## Overview
Hilega-Milega BUY SELL Signals is a momentum-based indicator built on the Relative Strength Index (RSI). It combines the RSI with a fast Exponential Moving Average (EMA) and a slow Weighted Moving Average (WMA) to identify potential bullish and bearish trend changes.
The indicator is designed to help traders identify high-probability intraday trading opportunities by filtering signals with both momentum and trend confirmation.
---
## How the Indicator Works
### 1. RSI (Relative Strength Index)
The indicator first calculates a 9-period RSI from the selected price source.
* RSI above 50 indicates bullish momentum.
* RSI below 50 indicates bearish momentum.
The 50 level acts as the primary trend filter.
---
### 2. EMA (3) of RSI
A 3-period Exponential Moving Average is applied to the RSI.
The EMA reacts quickly to changes in momentum and represents the short-term direction of the RSI.
---
### 3. WMA (21) of RSI
A 21-period Weighted Moving Average is also applied to the RSI.
The WMA moves more slowly than the EMA and represents the broader momentum trend.
---
### 4. RSI Background Color
The indicator colors the RSI area to provide quick visual confirmation of trend direction.
* **Red Background:** RSI is above 50 (Bullish Momentum)
* **Aqua Background:** RSI is below 50 (Bearish Momentum)
This allows traders to identify the prevailing momentum at a glance.
---
## Buy Signal
A BUY signal is generated only when all of the following conditions are satisfied:
* The 21-period WMA crosses above the RSI 50 level.
* The 3-period EMA is above the 21-period WMA.
* The RSI is above 50.
This combination indicates that both short-term and medium-term momentum have aligned in the bullish direction.
A BUY label is displayed on the chart when these conditions occur.
---
## Sell Signal
A SELL signal is generated only when all of the following conditions are satisfied:
* The 21-period WMA crosses below the RSI 50 level.
* The 3-period EMA is below the 21-period WMA.
* The RSI is below 50.
This indicates that bearish momentum has been confirmed.
A SELL label is displayed on the chart when these conditions occur.
---
## Alerts
The indicator provides TradingView alert conditions for both BUY and SELL signals.
These alerts can be used for:
* Pop-up notifications
* Mobile notifications
* Email alerts
* Webhook automation
---
## Recommended Timeframes
This indicator works on multiple timeframes, including:
* 3 Minute
* 5 Minute
* 15 Minute
* 30 Minute
* 1 Hour
It is particularly useful for intraday trading.
---
## Recommended Markets
The indicator can be used on:
* Stocks
* Index Futures
* Index Options
* ETFs
* Forex
* Commodities
* Cryptocurrencies
---
## Best Practice
For improved trade quality, use this indicator together with:
* Support and Resistance
* Volume Analysis
* VWAP
* Higher Timeframe Trend
* Risk Management
Avoid taking trades solely based on a single signal.
---
## Disclaimer
This indicator is designed by NK Sir as a technical analysis tool and should not be considered financial or investment advice. I Just Added BUY ,SELL Signals For Educational Purpose only .Please Add Hilega -Milega Indicator below your Chart to confirm Signals . Always perform your own analysis and use appropriate risk management before entering any trade.
Mã nguồn mở
Theo đúng tinh thần TradingView, tác giả của tập lệnh này đã công bố nó dưới dạng mã nguồn mở, để các nhà giao dịch có thể xem xét và xác minh chức năng. Chúc mừng tác giả! Mặc dù bạn có thể sử dụng miễn phí, hãy nhớ rằng việc công bố lại mã phải tuân theo Nội quy.

Thông báo miễn trừ trách nhiệm
Thông tin và các ấn phẩm này không nhằm mục đích, và không cấu thành, lời khuyên hoặc khuyến nghị về tài chính, đầu tư, giao dịch hay các loại khác do TradingView cung cấp hoặc xác nhận. Đọc thêm tại Điều khoản Sử dụng.
Mã nguồn mở
Theo đúng tinh thần TradingView, tác giả của tập lệnh này đã công bố nó dưới dạng mã nguồn mở, để các nhà giao dịch có thể xem xét và xác minh chức năng. Chúc mừng tác giả! Mặc dù bạn có thể sử dụng miễn phí, hãy nhớ rằng việc công bố lại mã phải tuân theo Nội quy.
Thông báo miễn trừ trách nhiệm
Thông tin và các ấn phẩm này không nhằm mục đích, và không cấu thành, lời khuyên hoặc khuyến nghị về tài chính, đầu tư, giao dịch hay các loại khác do TradingView cung cấp hoặc xác nhận. Đọc thêm tại Điều khoản Sử dụng.