OPEN-SOURCE SCRIPT
Cập nhật Implied vs Realized Volatility (IV vs RV)
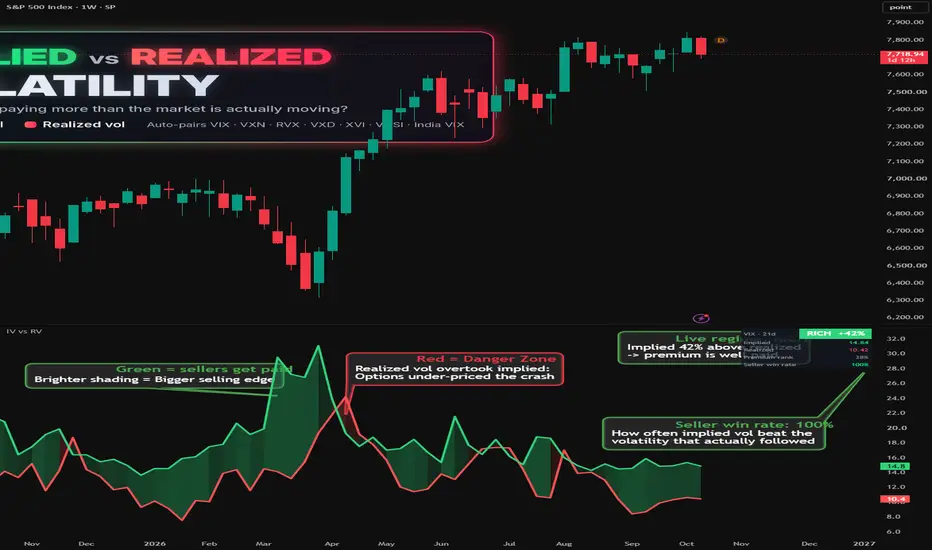
Are options paying more than the market is actually moving?
This indicator plots implied volatility (what the options market is pricing) against realized volatility (what the market is actually delivering), on the same scale, so you can see at a glance whether option premium is rich or thin.
WHAT IT SHOWS
- Green line: Implied volatility, the live vol index (e.g. VIX for the S&P 500).
- Red line: Realized volatility, how much the underlying index has really been moving over the same horizon.
- Shading between the lines: green when implied is above realized (options are pricing more movement than is happening), red when realized is above implied (the market is moving more than options are paying for). The bigger the gap, the brighter the shading.
THE TABLE
- Regime: RICH / FAIR / THIN / NEGATIVE, with the % implied is above or below realized (e.g. RICH +42%).
- Implied and Realized: the live values.
- Premium rank: where today's gap sits compared with the recent past (3M / 6M / 1Y). High = unusually fat premium.
- Seller win rate: over the last 21 days, how often the implied vol that was priced turned out higher than the volatility that actually followed. A reality check on whether premium has really been overpriced lately.
AUTO-PAIRING
Add it to a chart and it picks the right pair automatically. It works on the index, its main ETFs, futures and CFDs:
- S&P 500 (SPX, SPY, ES, US500): VIX
- Nasdaq 100 (NDX, QQQ, NQ): VXN
- Russell 2000 (RUT, IWM, RTY): RVX
- Dow Jones (DJI, DIA, YM): VXD
- ASX 200 (XJO, SPI futures, AUS200): XVI
- Hang Seng: VHSI · Nifty 50: India VIX
You can also choose a market manually, including VIX9D, VIX3M and VIX6M. The realized vol window adjusts automatically to match (e.g. VIX9D compares against roughly 9 days of realized vol, VIX against 21 trading days). Any other pair can be set under Custom.
HOW IT'S CALCULATED
Realized vol is close-to-close volatility of the underlying index, annualized to the same units as the vol index (zero-mean, the same convention used for variance swaps). It's built from completed daily closes plus today's live price, so it updates through the session and reads the same on any timeframe, from 1H to weekly. No repainting.
WHO IT'S FOR
- Option sellers: sell premium when it's rich, be careful when it's thin or negative.
- Option buyers: spot when protection is relatively cheap.
- Anyone wanting a quick read on whether the market is calmer or wilder than options expect.
NOTES
Implied and realized vol measure the size of moves, not their direction. A slow, steady trend can stay "low vol" while still travelling a long way, so use this alongside your own risk management. For educational purposes only, not financial advice.
Phát hành các Ghi chú
v1.1Phát hành các Ghi chú
v1.2Mã nguồn mở
Theo đúng tinh thần TradingView, tác giả của tập lệnh này đã công bố nó dưới dạng mã nguồn mở, để các nhà giao dịch có thể xem xét và xác minh chức năng. Chúc mừng tác giả! Mặc dù bạn có thể sử dụng miễn phí, hãy nhớ rằng việc công bố lại mã phải tuân theo Nội quy.

Thông báo miễn trừ trách nhiệm
Thông tin và các ấn phẩm này không nhằm mục đích, và không cấu thành, lời khuyên hoặc khuyến nghị về tài chính, đầu tư, giao dịch hay các loại khác do TradingView cung cấp hoặc xác nhận. Đọc thêm tại Điều khoản Sử dụng.
Mã nguồn mở
Theo đúng tinh thần TradingView, tác giả của tập lệnh này đã công bố nó dưới dạng mã nguồn mở, để các nhà giao dịch có thể xem xét và xác minh chức năng. Chúc mừng tác giả! Mặc dù bạn có thể sử dụng miễn phí, hãy nhớ rằng việc công bố lại mã phải tuân theo Nội quy.
Thông báo miễn trừ trách nhiệm
Thông tin và các ấn phẩm này không nhằm mục đích, và không cấu thành, lời khuyên hoặc khuyến nghị về tài chính, đầu tư, giao dịch hay các loại khác do TradingView cung cấp hoặc xác nhận. Đọc thêm tại Điều khoản Sử dụng.