OPEN-SOURCE SCRIPT
Price change area
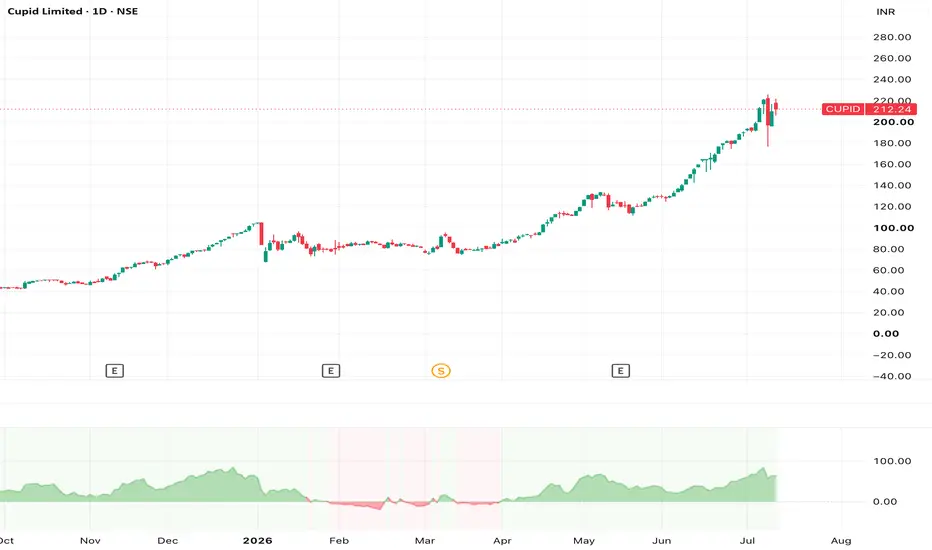
This indicator visualizes how much the price has changed over a configurable lookback period, displayed as a continuous area in a separate pane.
Features
• Two calculation modes:
• Exact % change – compares today’s close to the close exactly y bars ago.
• Max % change – shows the largest % move from an extreme (lowest or highest close) in the last y bars to today’s close.
• Configurable lookback: set the number of bars y (default: 30).
• Y-axis scale options:
• Ratio – displays values like 0.33 , -0.20 (i.e., +33%, −20%).
• Percent – displays values like 33.3 , -20.0 .
• Color-coded area:
• Green for positive change (price up over the lookback).
• Red for negative change (price down over the lookback).
• Zero line = no change.
How it works
• Uses closing prices only.
• For each bar, computes:
• Exact mode:
• Max mode:
• Finds lowest and highest close in the last y bars.
• Calculates up and down ratios from those extremes to today’s close.
• Plots the one with the larger absolute deviation from 1.
• Plots (ratio − 1) (or (ratio − 1) × 100 in Percent mode) as a filled area around the zero line.
Use cases
• Quickly spot strong up/down moves over a chosen period.
• Study historical volatility and momentum in terms of % change.
• Compare how different stocks or timeframes behave over similar lookback windows.
Inputs
• Lookback bars (y): number of bars to consider (default 30).
• Calculation Mode: “Exact % change” or “Max % change”.
• Y-Axis Scale: “Ratio” or “Percent”.
Features
• Two calculation modes:
• Exact % change – compares today’s close to the close exactly y bars ago.
• Max % change – shows the largest % move from an extreme (lowest or highest close) in the last y bars to today’s close.
• Configurable lookback: set the number of bars y (default: 30).
• Y-axis scale options:
• Ratio – displays values like 0.33 , -0.20 (i.e., +33%, −20%).
• Percent – displays values like 33.3 , -20.0 .
• Color-coded area:
• Green for positive change (price up over the lookback).
• Red for negative change (price down over the lookback).
• Zero line = no change.
How it works
• Uses closing prices only.
• For each bar, computes:
• Exact mode:
• Max mode:
• Finds lowest and highest close in the last y bars.
• Calculates up and down ratios from those extremes to today’s close.
• Plots the one with the larger absolute deviation from 1.
• Plots (ratio − 1) (or (ratio − 1) × 100 in Percent mode) as a filled area around the zero line.
Use cases
• Quickly spot strong up/down moves over a chosen period.
• Study historical volatility and momentum in terms of % change.
• Compare how different stocks or timeframes behave over similar lookback windows.
Inputs
• Lookback bars (y): number of bars to consider (default 30).
• Calculation Mode: “Exact % change” or “Max % change”.
• Y-Axis Scale: “Ratio” or “Percent”.
Mã nguồn mở
Theo đúng tinh thần TradingView, tác giả của tập lệnh này đã công bố nó dưới dạng mã nguồn mở, để các nhà giao dịch có thể xem xét và xác minh chức năng. Chúc mừng tác giả! Mặc dù bạn có thể sử dụng miễn phí, hãy nhớ rằng việc công bố lại mã phải tuân theo Nội quy.

Thông báo miễn trừ trách nhiệm
Thông tin và các ấn phẩm này không nhằm mục đích, và không cấu thành, lời khuyên hoặc khuyến nghị về tài chính, đầu tư, giao dịch hay các loại khác do TradingView cung cấp hoặc xác nhận. Đọc thêm tại Điều khoản Sử dụng.
Mã nguồn mở
Theo đúng tinh thần TradingView, tác giả của tập lệnh này đã công bố nó dưới dạng mã nguồn mở, để các nhà giao dịch có thể xem xét và xác minh chức năng. Chúc mừng tác giả! Mặc dù bạn có thể sử dụng miễn phí, hãy nhớ rằng việc công bố lại mã phải tuân theo Nội quy.
Thông báo miễn trừ trách nhiệm
Thông tin và các ấn phẩm này không nhằm mục đích, và không cấu thành, lời khuyên hoặc khuyến nghị về tài chính, đầu tư, giao dịch hay các loại khác do TradingView cung cấp hoặc xác nhận. Đọc thêm tại Điều khoản Sử dụng.