OPEN-SOURCE SCRIPT
Roy MACD Histogram EMA 5
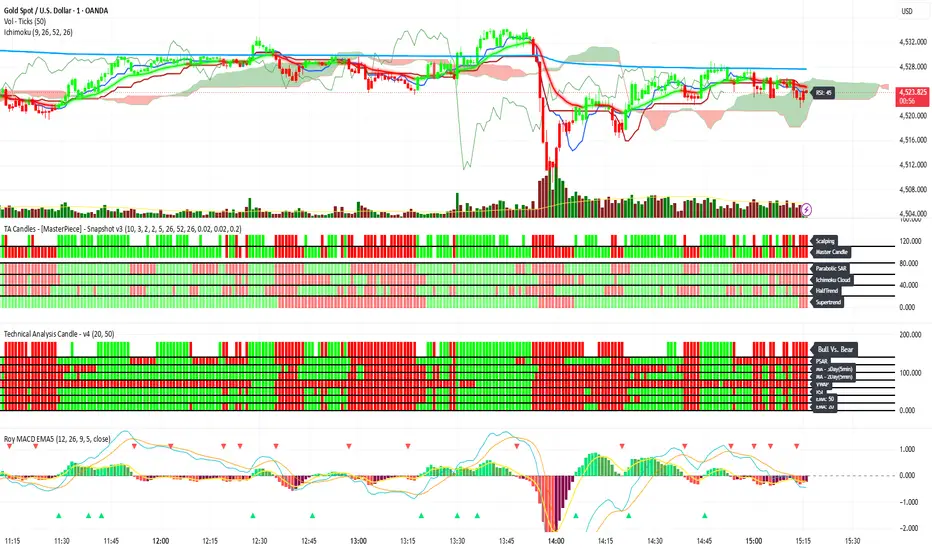
Roy MACD Histogram EMA 5 is a modified MACD momentum indicator with an additional EMA 5 line applied directly to the MACD histogram.
The EMA 5 Histogram helps traders read momentum strength, weakness, and early momentum changes more clearly compared to the standard MACD.
When the histogram is above the EMA 5 Histogram, bullish momentum is considered stronger. When the histogram is below the EMA 5 Histogram, bearish momentum is considered stronger or bullish momentum may be weakening.
This indicator includes MACD Line, Signal Line, Histogram, EMA 5 Histogram, and simple momentum markers to highlight potential bullish or bearish momentum shifts.
Best used together with price action, support and resistance, trendline, market structure, EMA 50/100/200, and proper risk management.
This indicator is not a financial advice or a guaranteed signal system. Always backtest and use proper money management.
The EMA 5 Histogram helps traders read momentum strength, weakness, and early momentum changes more clearly compared to the standard MACD.
When the histogram is above the EMA 5 Histogram, bullish momentum is considered stronger. When the histogram is below the EMA 5 Histogram, bearish momentum is considered stronger or bullish momentum may be weakening.
This indicator includes MACD Line, Signal Line, Histogram, EMA 5 Histogram, and simple momentum markers to highlight potential bullish or bearish momentum shifts.
Best used together with price action, support and resistance, trendline, market structure, EMA 50/100/200, and proper risk management.
This indicator is not a financial advice or a guaranteed signal system. Always backtest and use proper money management.
Mã nguồn mở
Theo đúng tinh thần TradingView, tác giả của tập lệnh này đã công bố nó dưới dạng mã nguồn mở, để các nhà giao dịch có thể xem xét và xác minh chức năng. Chúc mừng tác giả! Mặc dù bạn có thể sử dụng miễn phí, hãy nhớ rằng việc công bố lại mã phải tuân theo Nội quy.

Thông báo miễn trừ trách nhiệm
Thông tin và các ấn phẩm này không nhằm mục đích, và không cấu thành, lời khuyên hoặc khuyến nghị về tài chính, đầu tư, giao dịch hay các loại khác do TradingView cung cấp hoặc xác nhận. Đọc thêm tại Điều khoản Sử dụng.
Mã nguồn mở
Theo đúng tinh thần TradingView, tác giả của tập lệnh này đã công bố nó dưới dạng mã nguồn mở, để các nhà giao dịch có thể xem xét và xác minh chức năng. Chúc mừng tác giả! Mặc dù bạn có thể sử dụng miễn phí, hãy nhớ rằng việc công bố lại mã phải tuân theo Nội quy.
Thông báo miễn trừ trách nhiệm
Thông tin và các ấn phẩm này không nhằm mục đích, và không cấu thành, lời khuyên hoặc khuyến nghị về tài chính, đầu tư, giao dịch hay các loại khác do TradingView cung cấp hoặc xác nhận. Đọc thêm tại Điều khoản Sử dụng.