Cập nhật
BTC Power Law Regime Suite
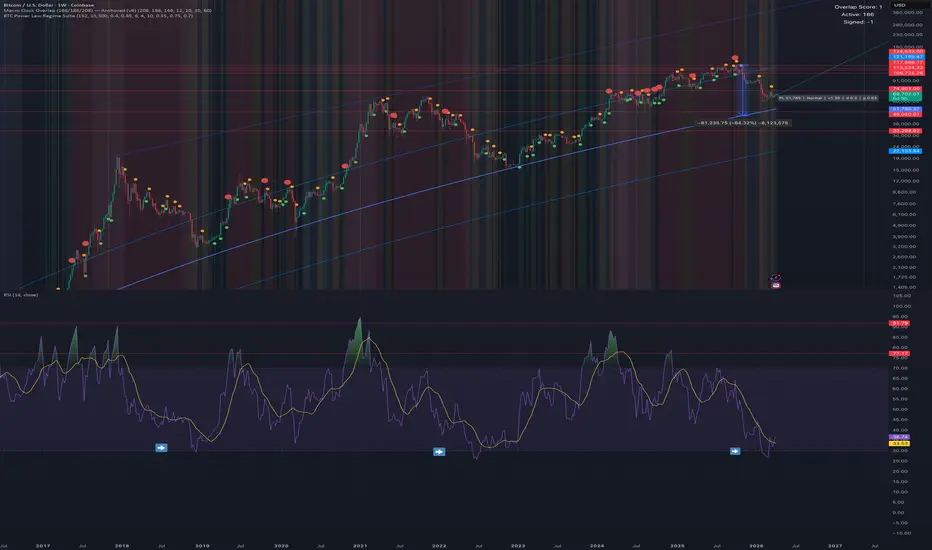
Short Description, TLDR
BTC Power Law Regime Suite models Bitcoin’s long-term growth as a power law anchored to major bear market lows, then classifies price action into three macro regimes: Expansion, Distribution, and Blow-off. It is designed to show when BTC is behaving normally relative to its long-term adoption curve, when momentum is strengthening, and when price is becoming dangerously extended.
Long Descript
BTC Power Law Regime Suite is a macro Bitcoin indicator built around a simple idea:
Bitcoin does not move in a straight line. Over long periods, it appears to grow along a curved adoption path, while shorter-term price action oscillates above and below that path in cycles of fear, expansion, euphoria, and exhaustion.
This script models that long-term path as a power law curve, then measures how far price has moved away from it and whether that move is still accelerating or beginning to fade.
Core idea
The script uses a two-anchor power law model based on major BTC bear market lows. Instead of forcing arbitrary coefficients, the curve is derived from two historical anchor points. This creates a more practical “gravity line” that represents Bitcoin’s long-run structural trend.
From there, the indicator evaluates three things:
1. Distance from the power law
This tells us how stretched price is relative to the long-term curve.
2. Relative slope
This measures whether BTC is gaining or losing momentum relative to that curve.
3. Relative acceleration
This helps distinguish normal trend expansion from truly parabolic behavior.
By combining those three factors, the script identifies the market’s current macro regime.
Regimes
Expansion
BTC is above its structural trend and momentum is still improving. This is the healthy bullish phase where price is rising faster than the baseline without yet showing obvious exhaustion.
Distribution
BTC remains elevated relative to the power law, but momentum and acceleration are fading. This is the “high but weakening” condition often seen near slow or choppy tops.
Blow-off
BTC is far above the long-term curve and has recently experienced strong acceleration. This is the classic mania or parabolic exhaustion phase.
Visual design
The script is intentionally minimal:
A power law baseline shows the long-term BTC path.
Optional outer orbit bands provide a macro envelope around that path.
A background regime overlay highlights Expansion, Distribution, and Blow-off conditions.
Small markers can optionally mark the beginning of new regime transitions.
A compact status label summarizes current state without cluttering the chart.
The goal is not to create a noisy signal generator, but a clean macro framework for reading Bitcoin’s cycle structure.
How to use it
This indicator works best on:
BTCUSD / BTCUSDT
Weekly timeframe
Log scale enabled
It is designed for macro cycle analysis, not short-term trading entries.
A common way to interpret it:
Near or below the power law: BTC is closer to long-term value or compression
Expansion regime: bullish momentum is building above the baseline
Distribution regime: price remains elevated, but internal strength is deteriorating
Blow-off regime: risk of euphoric exhaustion is rising
Important notes
This script is heuristic, not predictive. It does not forecast tops or bottoms with certainty, and it should not be treated as a standalone trading system.
Its purpose is to provide a structured way to think about:
Bitcoin’s long-term growth path
cyclical overextension
the difference between healthy expansion and late-stage exhaustion
The model is especially useful because it separates being high from still accelerating. That distinction matters. Not every top is a blow-off, and not every overextended market is still in active mania.
Why this script exists
Most Bitcoin models focus on only one dimension:
valuation relative to trend
or momentum
or cycle bands
or parabolic blow-offs
This script tries to combine those into one clean framework:
Power law = structural gravity
Distance = over/underextension
Acceleration = cycle intensity
Regime = market state
That makes it useful for identifying whether BTC is:
trending normally
expanding aggressively
distributing at elevated levels
or entering true blow-off behavior
Phát hành các Ghi chú
Short Description, TLDRBTC Power Law Regime Suite models Bitcoin’s long-term growth as a power law anchored to major bear market lows, then classifies price action into three macro regimes: Expansion, Distribution, and Blow-off. It is designed to show when BTC is behaving normally relative to its long-term adoption curve, when momentum is strengthening, and when price is becoming dangerously extended.
Long Descript
BTC Power Law Regime Suite is a macro Bitcoin indicator built around a simple idea:
Bitcoin does not move in a straight line. Over long periods, it appears to grow along a curved adoption path, while shorter-term price action oscillates above and below that path in cycles of fear, expansion, euphoria, and exhaustion.
This script models that long-term path as a power law curve, then measures how far price has moved away from it and whether that move is still accelerating or beginning to fade.
Core idea
The script uses a two-anchor power law model based on major BTC bear market lows. Instead of forcing arbitrary coefficients, the curve is derived from two historical anchor points. This creates a more practical “gravity line” that represents Bitcoin’s long-run structural trend.
From there, the indicator evaluates three things:
1. Distance from the power law
This tells us how stretched price is relative to the long-term curve.
2. Relative slope
This measures whether BTC is gaining or losing momentum relative to that curve.
3. Relative acceleration
This helps distinguish normal trend expansion from truly parabolic behavior.
By combining those three factors, the script identifies the market’s current macro regime.
Regimes
Expansion
BTC is above its structural trend and momentum is still improving. This is the healthy bullish phase where price is rising faster than the baseline without yet showing obvious exhaustion.
Distribution
BTC remains elevated relative to the power law, but momentum and acceleration are fading. This is the “high but weakening” condition often seen near slow or choppy tops.
Blow-off
BTC is far above the long-term curve and has recently experienced strong acceleration. This is the classic mania or parabolic exhaustion phase.
Visual design
The script is intentionally minimal:
A power law baseline shows the long-term BTC path.
Optional outer orbit bands provide a macro envelope around that path.
A background regime overlay highlights Expansion, Distribution, and Blow-off conditions.
Small markers can optionally mark the beginning of new regime transitions.
A compact status label summarizes current state without cluttering the chart.
The goal is not to create a noisy signal generator, but a clean macro framework for reading Bitcoin’s cycle structure.
How to use it
This indicator works best on:
BTCUSD / BTCUSDT
Weekly timeframe
Log scale enabled
It is designed for macro cycle analysis, not short-term trading entries.
A common way to interpret it:
Near or below the power law: BTC is closer to long-term value or compression
Expansion regime: bullish momentum is building above the baseline
Distribution regime: price remains elevated, but internal strength is deteriorating
Blow-off regime: risk of euphoric exhaustion is rising
Important notes
This script is heuristic, not predictive. It does not forecast tops or bottoms with certainty, and it should not be treated as a standalone trading system.
Its purpose is to provide a structured way to think about:
Bitcoin’s long-term growth path
cyclical overextension
the difference between healthy expansion and late-stage exhaustion
The model is especially useful because it separates being high from still accelerating. That distinction matters. Not every top is a blow-off, and not every overextended market is still in active mania.
Why this script exists
Most Bitcoin models focus on only one dimension:
valuation relative to trend
or momentum
or cycle bands
or parabolic blow-offs
This script tries to combine those into one clean framework:
Power law = structural gravity
Distance = over/underextension
Acceleration = cycle intensity
Regime = market state
That makes it useful for identifying whether BTC is:
trending normally
expanding aggressively
distributing at elevated levels
or entering true blow-off behavior
Signal Markers
The script includes optional minimal markers to highlight when the market transitions between regimes. These are intentionally subtle to avoid clutter.
Green dot (below price)
Indicates the start of an Expansion phase.
Price is above the power law and momentum is building.
Orange dot (above price)
Indicates the start of a Distribution phase.
Price remains elevated, but momentum and acceleration are fading.
Red dot (above price)
Indicates the start of a Blow-off phase.
Price is significantly extended above the long-term curve and has recently experienced strong acceleration.
These markers are event-based, not continuous signals. They only appear when a new regime condition is first met, rather than on every bar.
How to interpret them
The markers are best used as contextual cues, not trading signals:
A green dot suggests momentum is strengthening and a trend expansion may be underway.
An orange dot suggests the market may be entering a late-stage phase where risk increases, even if price continues higher.
A red dot highlights conditions typically associated with euphoric or parabolic behavior, where reversals become more likely.
Important note
Markers do not guarantee tops or bottoms.
They reflect changes in structure and momentum relative to the power law, not precise timing signals.

Thông báo miễn trừ trách nhiệm
Thông tin và các ấn phẩm này không nhằm mục đích, và không cấu thành, lời khuyên hoặc khuyến nghị về tài chính, đầu tư, giao dịch hay các loại khác do TradingView cung cấp hoặc xác nhận. Đọc thêm tại Điều khoản Sử dụng.
Thông báo miễn trừ trách nhiệm
Thông tin và các ấn phẩm này không nhằm mục đích, và không cấu thành, lời khuyên hoặc khuyến nghị về tài chính, đầu tư, giao dịch hay các loại khác do TradingView cung cấp hoặc xác nhận. Đọc thêm tại Điều khoản Sử dụng.