OPEN-SOURCE SCRIPT
Price*Volume Z-Score Oscillator
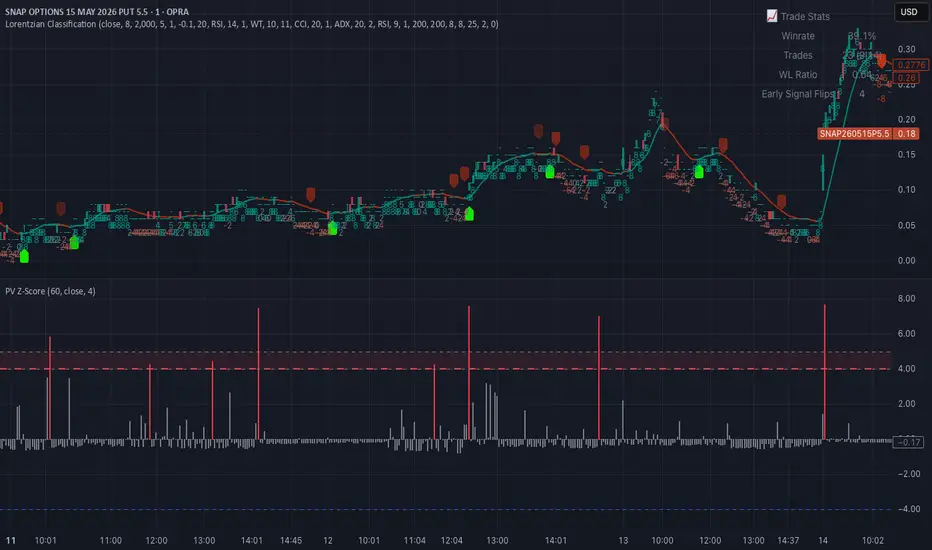
Useful for finding statistically significant order blocks for OTM options on stocks. Used to find "informed traders".
To understand the math behind this indicator, we have to break it down into three distinct layers: the **Variable Construction**, the **Central Limit Theorem application**, and the **Z-Transformation**.
---
### 1. The Variable: Dollar Volume ( PV$)
Instead of looking at Price or Volume in isolation, we create a composite variable:
$$PV_t = P_t \times V_t$$
* **$P_t$**: The closing price at time $t$.
* **$V_t$**: The number of shares/contracts traded at time $t$.
This represents the total **nominal value** flowing through the asset. It is a more rigorous measure of market conviction than volume alone because it accounts for the capital required to move the price at that specific level.
---
### 2. The Moving Window (Rolling Statistics)
We don't compare the currentPV$ to the beginning of time; we compare it to a **lookback window** ($n=20$).
#### The Arithmetic Mean ($\mu$)
We calculate the Simple Moving Average of thePV$ product:
$$\mu_{PV} = \frac{1}{n} \sum_{i=0}^{n-1} PV_{t-i}$$
This establishes the "expected" liquidity environment for the current regime.
#### The Standard Deviation ($\sigma$)
We measure the dispersion (volatility) of thePV$ product over that same window:
$$\sigma_{PV} = \sqrt{\frac{1}{n} \sum_{i=0}^{n-1} (PV_{t-i} - \mu_{PV})^2}$$
This tells us how much the "Dollar Volume" typically fluctuates. If $\sigma$ is high, the market is erratic; if $\sigma$ is low, the market is consistent.
---
### 3. The Z-Score Transformation
The Z-score is a "dimensionless" number. It strips away the dollar signs and the share counts, leaving only a pure measure of **distance in units of volatility**.
$$Z = \frac{PV_{current} - \mu_{PV}}{\sigma_{PV}}$$
* **If $Z = 0$**: The current Dollar Volume is exactly average.
* **If $Z = 1$**: The current Dollar Volume is 1 Standard Deviation above average.
* **If $Z = 4$**: The current Dollar Volume is an extreme outlier.
---
### 4. The "4 StDev" Threshold (Statistical Significance)
Why is $Z \ge 4$ significant? We use the **Empirical Rule** and **Chebyshev’s Inequality** to understand the probability:
| Z-Score | Probability (Normal Dist.) | Frequency of Occurrence |
| --- | --- | --- |
| **1.0** | 68.2% | Common |
| **2.0** | 95.4% | Significant (95th percentile) |
| **3.0** | 99.7% | Rare (The "Three-Sigma" event) |
| **4.0** | **99.993%** | **Extreme Outlier** |
In a perfectly normal distribution, a Z-score of 4 should only happen roughly **once every 15,000 bars**.
> **The Reality of "Fat Tails":** Financial data is not perfectly normal; it has "leptokurtosis" (fat tails). This means 4 StDev events happen more often than 0.01% in trading. When you see $Z > 4$, you aren't seeing random noise; you are seeing a **non-random liquidity shock**—likely institutional block trades or massive delta-hedging rebalancing.
### Why this matters for your 0DTE research:
In 0DTE options, Gamma is at its peak. A $Z > 4$ event in the underlyingPV$ product suggests a sudden burst of activity that can force market makers to hedge aggressively. Since $Z$ is rolling, the "average" adapts to the day's volatility, ensuring that a "spike" in the morning is measured differently than a "spike" during the slow lunch hour.
To understand the math behind this indicator, we have to break it down into three distinct layers: the **Variable Construction**, the **Central Limit Theorem application**, and the **Z-Transformation**.
---
### 1. The Variable: Dollar Volume (
PV$)Instead of looking at Price or Volume in isolation, we create a composite variable:
$$PV_t = P_t \times V_t$$
* **$P_t$**: The closing price at time $t$.
* **$V_t$**: The number of shares/contracts traded at time $t$.
This represents the total **nominal value** flowing through the asset. It is a more rigorous measure of market conviction than volume alone because it accounts for the capital required to move the price at that specific level.
---
### 2. The Moving Window (Rolling Statistics)
We don't compare the current
PV$ to the beginning of time; we compare it to a **lookback window** ($n=20$).#### The Arithmetic Mean ($\mu$)
We calculate the Simple Moving Average of the
PV$ product:$$\mu_{PV} = \frac{1}{n} \sum_{i=0}^{n-1} PV_{t-i}$$
This establishes the "expected" liquidity environment for the current regime.
#### The Standard Deviation ($\sigma$)
We measure the dispersion (volatility) of the
PV$ product over that same window:$$\sigma_{PV} = \sqrt{\frac{1}{n} \sum_{i=0}^{n-1} (PV_{t-i} - \mu_{PV})^2}$$
This tells us how much the "Dollar Volume" typically fluctuates. If $\sigma$ is high, the market is erratic; if $\sigma$ is low, the market is consistent.
---
### 3. The Z-Score Transformation
The Z-score is a "dimensionless" number. It strips away the dollar signs and the share counts, leaving only a pure measure of **distance in units of volatility**.
$$Z = \frac{PV_{current} - \mu_{PV}}{\sigma_{PV}}$$
* **If $Z = 0$**: The current Dollar Volume is exactly average.
* **If $Z = 1$**: The current Dollar Volume is 1 Standard Deviation above average.
* **If $Z = 4$**: The current Dollar Volume is an extreme outlier.
---
### 4. The "4 StDev" Threshold (Statistical Significance)
Why is $Z \ge 4$ significant? We use the **Empirical Rule** and **Chebyshev’s Inequality** to understand the probability:
| Z-Score | Probability (Normal Dist.) | Frequency of Occurrence |
| --- | --- | --- |
| **1.0** | 68.2% | Common |
| **2.0** | 95.4% | Significant (95th percentile) |
| **3.0** | 99.7% | Rare (The "Three-Sigma" event) |
| **4.0** | **99.993%** | **Extreme Outlier** |
In a perfectly normal distribution, a Z-score of 4 should only happen roughly **once every 15,000 bars**.
> **The Reality of "Fat Tails":** Financial data is not perfectly normal; it has "leptokurtosis" (fat tails). This means 4 StDev events happen more often than 0.01% in trading. When you see $Z > 4$, you aren't seeing random noise; you are seeing a **non-random liquidity shock**—likely institutional block trades or massive delta-hedging rebalancing.
### Why this matters for your 0DTE research:
In 0DTE options, Gamma is at its peak. A $Z > 4$ event in the underlying
PV$ product suggests a sudden burst of activity that can force market makers to hedge aggressively. Since $Z$ is rolling, the "average" adapts to the day's volatility, ensuring that a "spike" in the morning is measured differently than a "spike" during the slow lunch hour.Mã nguồn mở
Theo đúng tinh thần TradingView, tác giả của tập lệnh này đã công bố nó dưới dạng mã nguồn mở, để các nhà giao dịch có thể xem xét và xác minh chức năng. Chúc mừng tác giả! Mặc dù bạn có thể sử dụng miễn phí, hãy nhớ rằng việc công bố lại mã phải tuân theo Nội quy.

Thông báo miễn trừ trách nhiệm
Thông tin và các ấn phẩm này không nhằm mục đích, và không cấu thành, lời khuyên hoặc khuyến nghị về tài chính, đầu tư, giao dịch hay các loại khác do TradingView cung cấp hoặc xác nhận. Đọc thêm tại Điều khoản Sử dụng.
Mã nguồn mở
Theo đúng tinh thần TradingView, tác giả của tập lệnh này đã công bố nó dưới dạng mã nguồn mở, để các nhà giao dịch có thể xem xét và xác minh chức năng. Chúc mừng tác giả! Mặc dù bạn có thể sử dụng miễn phí, hãy nhớ rằng việc công bố lại mã phải tuân theo Nội quy.
Thông báo miễn trừ trách nhiệm
Thông tin và các ấn phẩm này không nhằm mục đích, và không cấu thành, lời khuyên hoặc khuyến nghị về tài chính, đầu tư, giao dịch hay các loại khác do TradingView cung cấp hoặc xác nhận. Đọc thêm tại Điều khoản Sử dụng.