[ad] HTF
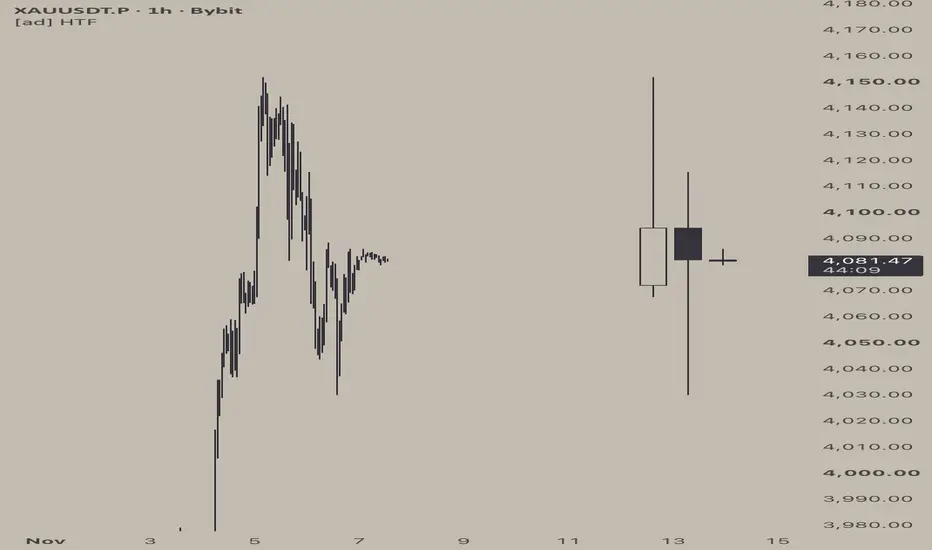
[ad] HTF displays the latest higher-timeframe candles to the right of your chart on the same price scale. It lets you compare the current intraday move with the higher-timeframe candle bodies and wicks without switching intervals.
Choose H4, Daily, 3 Days, Weekly, or Monthly in the indicator settings. The default is three Daily candles. You can display 2 to 10 candles, including the current one. The oldest candle is on the left; the rightmost candle updates as new data arrives. Closed candles use the symbol's native OHLC data for the selected timeframe.
The indicator works on standard minute-based charts from 1 minute through 4 hours when the selected candle timeframe is strictly higher than the chart timeframe. Adjust the offset, candle width, and colors in the settings. The XAUUSDT.P 1-hour example uses custom colors and spacing. If the candles are clipped, drag the chart left to make room or reduce the offset or width.
If the current higher-timeframe candle is unavailable from the feed, the indicator temporarily builds it from available chart bars. It may differ from the native candle when chart history is limited or a bar crosses a timeframe boundary.
For chart context only. No signals, alerts, or financial advice.
Choose H4, Daily, 3 Days, Weekly, or Monthly in the indicator settings. The default is three Daily candles. You can display 2 to 10 candles, including the current one. The oldest candle is on the left; the rightmost candle updates as new data arrives. Closed candles use the symbol's native OHLC data for the selected timeframe.
The indicator works on standard minute-based charts from 1 minute through 4 hours when the selected candle timeframe is strictly higher than the chart timeframe. Adjust the offset, candle width, and colors in the settings. The XAUUSDT.P 1-hour example uses custom colors and spacing. If the candles are clipped, drag the chart left to make room or reduce the offset or width.
If the current higher-timeframe candle is unavailable from the feed, the indicator temporarily builds it from available chart bars. It may differ from the native candle when chart history is limited or a bar crosses a timeframe boundary.
For chart context only. No signals, alerts, or financial advice.

Thông báo miễn trừ trách nhiệm
Thông tin và các ấn phẩm này không nhằm mục đích, và không cấu thành, lời khuyên hoặc khuyến nghị về tài chính, đầu tư, giao dịch hay các loại khác do TradingView cung cấp hoặc xác nhận. Đọc thêm tại Điều khoản Sử dụng.
Thông báo miễn trừ trách nhiệm
Thông tin và các ấn phẩm này không nhằm mục đích, và không cấu thành, lời khuyên hoặc khuyến nghị về tài chính, đầu tư, giao dịch hay các loại khác do TradingView cung cấp hoặc xác nhận. Đọc thêm tại Điều khoản Sử dụng.