OPEN-SOURCE SCRIPT
Apex Volatility Squeeze & Breakout [Pineify]
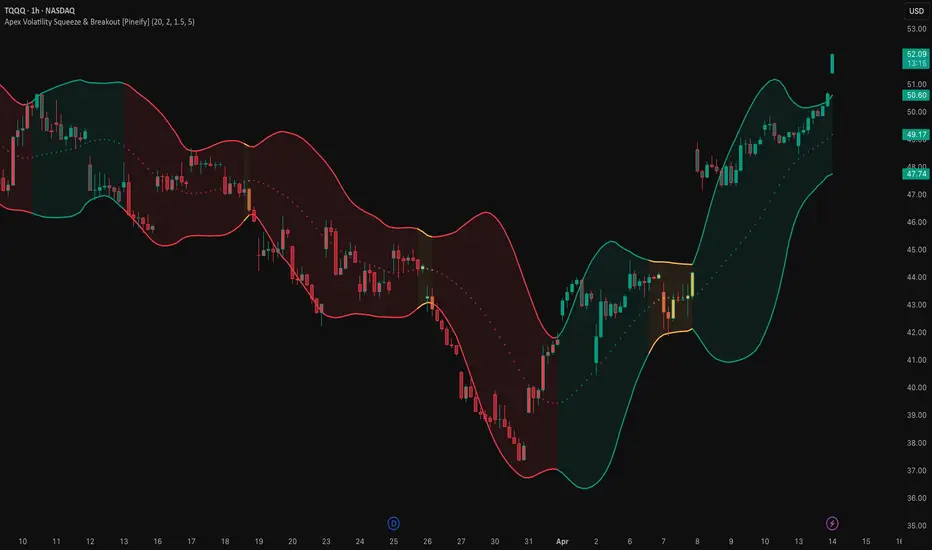
Apex Volatility Squeeze & Breakout [Pineify]
The Apex Volatility Squeeze & Breakout indicator is a dynamic volatility analysis tool that identifies market compression (squeeze) phases and highlights potential breakout opportunities in real time. Built on the well-established principles of Bollinger Bands and Keltner Channels, this indicator synthesizes both into a single, unified volatility channel with a clear three-state trend system — giving traders an intuitive and actionable view of market volatility conditions on any symbol and timeframe.
Key Features
How It Works
This indicator operates on a core concept: when volatility contracts, a breakout is imminent. Here is how the calculation pipeline works:
Trading Ideas and Insights
The squeeze state is the most critical signal this indicator provides. When the bands contract and the channel turns orange (default squeeze color), the market is consolidating and building energy. Traders should watch closely for the following scenarios:
How Multiple Indicators Work Together
This script merges two complementary volatility methodologies into a single coherent system:
Unique Aspects
How to Use
Customization
Conclusion
The Apex Volatility Squeeze & Breakout indicator offers traders a clean, intuitive way to identify low-volatility squeeze conditions and potential breakout points. By fusing Bollinger Band width analysis with Keltner Channel ATR thresholds and applying EMA smoothing, it delivers a unified volatility channel that is both visually elegant and analytically powerful. Whether you trade stocks, forex, crypto, or futures, this tool helps you spot the moments when the market is coiling for its next big move — and positions you to act on it with confidence.
The Apex Volatility Squeeze & Breakout indicator is a dynamic volatility analysis tool that identifies market compression (squeeze) phases and highlights potential breakout opportunities in real time. Built on the well-established principles of Bollinger Bands and Keltner Channels, this indicator synthesizes both into a single, unified volatility channel with a clear three-state trend system — giving traders an intuitive and actionable view of market volatility conditions on any symbol and timeframe.
Key Features
- Unified volatility channel combining Bollinger Band width and Keltner Channel (ATR) threshold
- Three-state trend detection: Bullish, Bearish, and Squeeze (consolidation)
- Smoothed bands using EMA to reduce noise and false signals
- Color-coded volatility cloud with dynamic candle coloring
- Built-in Buy and Sell breakout signal labels
- Alert conditions for automated trading notifications
- Fully customizable parameters for lookback period, multipliers, smoothing, and colors
How It Works
This indicator operates on a core concept: when volatility contracts, a breakout is imminent. Here is how the calculation pipeline works:
- A Simple Moving Average (SMA) of the close price is calculated over the user-defined lookback period to establish the basis line.
- Standard deviation of price is computed and scaled by a Band Multiplier to determine the upper and lower Bollinger-style volatility bands.
- The Average True Range (ATR) is computed over the same period and scaled by a Squeeze Multiplier to establish the Keltner Channel threshold.
- A squeeze state is detected when the Bollinger Band width (scaled standard deviation) is less than the Keltner Channel width (scaled ATR) — this means volatility has compressed below normal levels.
- Both the upper band, lower band, and basis are smoothed using an Exponential Moving Average (EMA) to produce a clean, noiseless visual channel.
- A trend state machine determines the current market phase: Bullish (+1) when price trades above the upper band outside a squeeze, Bearish (-1) when price trades below the lower band outside a squeeze, and Squeeze (0) when volatility is compressed.
Trading Ideas and Insights
The squeeze state is the most critical signal this indicator provides. When the bands contract and the channel turns orange (default squeeze color), the market is consolidating and building energy. Traders should watch closely for the following scenarios:
- A bullish breakout occurs when price crosses above the upper smoothed band after a squeeze period, indicating upward momentum.
- A bearish breakout occurs when price crosses below the lower smoothed band after a squeeze period, indicating downward momentum.
- During the squeeze phase, traders may choose to reduce position sizes and wait for directional confirmation.
- The color transition of the volatility cloud — from orange (squeeze) to green (bullish) or red (bearish) — provides a clear visual cue for trend changes.
How Multiple Indicators Work Together
This script merges two complementary volatility methodologies into a single coherent system:
- Bollinger Bands (Standard Deviation) measure statistical volatility — how far price deviates from the mean. They expand during volatile markets and contract during quiet markets.
- Keltner Channels (ATR) measure range-based volatility — the average true range of price movement. They provide a more stable, less reactive volatility baseline.
- By comparing these two measures, the indicator identifies squeeze conditions: when the faster-reacting Bollinger Band width falls below the slower ATR threshold, it signals abnormal compression. This is the classic "squeeze" concept pioneered by John Carter's TTM Squeeze, adapted here with EMA smoothing for cleaner signals.
- The EMA smoothing layer is applied on top of the raw bands to eliminate whipsaw noise. This creates a smoother channel that is easier to read and trade, especially on lower timeframes.
- The trend state machine ties everything together by classifying the market into three clear phases, which then drive the dynamic coloring of the bands, cloud fill, and candle colors — creating a unified visual experience.
Unique Aspects
- Unlike standard squeeze indicators that only display a binary squeeze/no-squeeze state, this indicator provides a full directional trend classification with three states, color-coded across all visual elements.
- The EMA-smoothed volatility channel is visually cleaner than traditional Bollinger Bands or Keltner Channels, making it easier to identify trend direction at a glance.
- The volatility cloud fill adapts its color in real time based on the current trend state, providing immediate visual feedback on whether the market is trending bullish, bearish, or consolidating.
- Candle coloring is also driven by the volatility state, allowing traders to spot trend alignment without needing to inspect the bands directly.
How to Use
- Add the indicator to your chart. It overlays directly on the price chart.
- Watch for the orange squeeze zone — this indicates low volatility and a potential breakout ahead.
- When the channel transitions from orange to green, the market is breaking out bullish. When it turns red, the breakout is bearish.
- Use the BUY and SELL labels as entry signals when price escapes the squeeze zone and crosses the smoothed bands.
- Set up alerts using the built-in alert conditions ("Bullish Volatility Breakout" and "Bearish Volatility Breakout") to receive notifications without watching the chart.
- Combine with volume analysis or momentum oscillators for additional confirmation of breakout strength.
Customization
- Lookback Length (default: 20) — The period for calculating the SMA, Standard Deviation, and ATR. Shorter periods make the indicator more reactive; longer periods produce smoother, more reliable signals.
- Band Multiplier (StDev) (default: 2.0) — Controls the width of the volatility bands. Higher values create wider bands and fewer breakout signals.
- Squeeze Multiplier (ATR) (default: 1.5) — Sets the threshold for squeeze detection. Lower values detect squeezes more aggressively; higher values require stronger compression.
- Band Smoothing (default: 5) — The EMA smoothing period applied to the bands. Higher values produce smoother bands with more lag.
- Color Settings — Fully customizable colors for bullish, bearish, and squeeze states.
- Candle Coloring — Toggle on/off to color candles based on the current volatility trend state.
Conclusion
The Apex Volatility Squeeze & Breakout indicator offers traders a clean, intuitive way to identify low-volatility squeeze conditions and potential breakout points. By fusing Bollinger Band width analysis with Keltner Channel ATR thresholds and applying EMA smoothing, it delivers a unified volatility channel that is both visually elegant and analytically powerful. Whether you trade stocks, forex, crypto, or futures, this tool helps you spot the moments when the market is coiling for its next big move — and positions you to act on it with confidence.
Mã nguồn mở
Theo đúng tinh thần TradingView, tác giả của tập lệnh này đã công bố nó dưới dạng mã nguồn mở, để các nhà giao dịch có thể xem xét và xác minh chức năng. Chúc mừng tác giả! Mặc dù bạn có thể sử dụng miễn phí, hãy nhớ rằng việc công bố lại mã phải tuân theo Nội quy.

🚀🚀🚀 Pineify - pineify.app
Essential Toolkit for Every Trader
- AI Pine Script Generator
- Finance AI Agent
- AI Stock Picker
- Pine Script Visual Editor
- Invited indicators
- Strategy Optimizer
- Trading Journal
- Backtest Report
Essential Toolkit for Every Trader
- AI Pine Script Generator
- Finance AI Agent
- AI Stock Picker
- Pine Script Visual Editor
- Invited indicators
- Strategy Optimizer
- Trading Journal
- Backtest Report
Thông báo miễn trừ trách nhiệm
Thông tin và các ấn phẩm này không nhằm mục đích, và không cấu thành, lời khuyên hoặc khuyến nghị về tài chính, đầu tư, giao dịch hay các loại khác do TradingView cung cấp hoặc xác nhận. Đọc thêm tại Điều khoản Sử dụng.
Mã nguồn mở
Theo đúng tinh thần TradingView, tác giả của tập lệnh này đã công bố nó dưới dạng mã nguồn mở, để các nhà giao dịch có thể xem xét và xác minh chức năng. Chúc mừng tác giả! Mặc dù bạn có thể sử dụng miễn phí, hãy nhớ rằng việc công bố lại mã phải tuân theo Nội quy.
🚀🚀🚀 Pineify - pineify.app
Essential Toolkit for Every Trader
- AI Pine Script Generator
- Finance AI Agent
- AI Stock Picker
- Pine Script Visual Editor
- Invited indicators
- Strategy Optimizer
- Trading Journal
- Backtest Report
Essential Toolkit for Every Trader
- AI Pine Script Generator
- Finance AI Agent
- AI Stock Picker
- Pine Script Visual Editor
- Invited indicators
- Strategy Optimizer
- Trading Journal
- Backtest Report
Thông báo miễn trừ trách nhiệm
Thông tin và các ấn phẩm này không nhằm mục đích, và không cấu thành, lời khuyên hoặc khuyến nghị về tài chính, đầu tư, giao dịch hay các loại khác do TradingView cung cấp hoặc xác nhận. Đọc thêm tại Điều khoản Sử dụng.