Cập nhật
Aquila Reale Gold Drivers
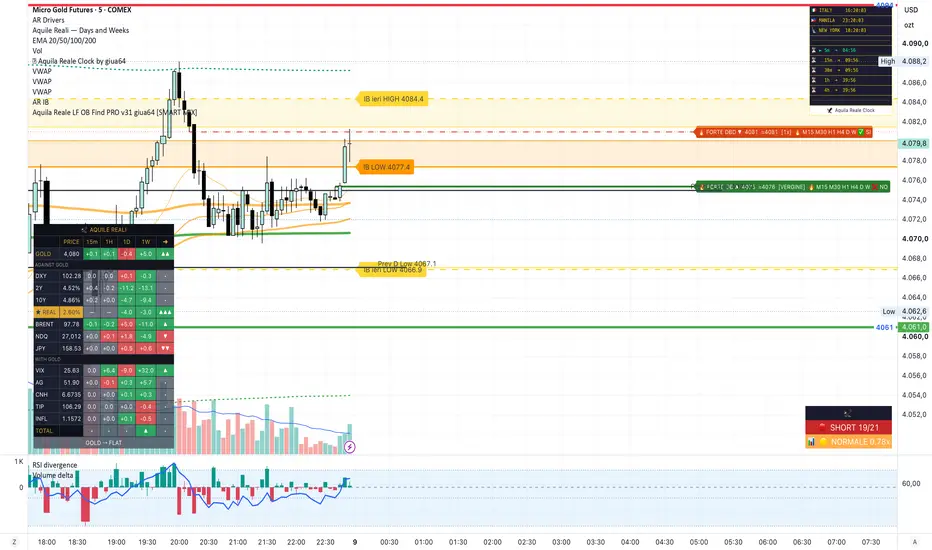
Aquila Reale – Gold Drivers
I have written many indicators for gold over the years, but this is the simplest one and, honestly, the one I find most useful while I am actually in a trade.
When I trade gold, the hardest moments are the ones where price moves and I don't know why. Most of the time the answer is outside my chart: the dollar, yields, oil, fear, equities. Gold Drivers puts all of those assets in one small table on the gold chart and tells me, at a glance, whether they are helping gold or working against it, and it alerts me when one of them moves abnormally.
WHAT IT SHOWS
Rows (assets that move gold), grouped by relationship:
Against gold
- DXY: the US dollar
- 2Y: US 2-year yield, the market's bet on the Fed
- 10Y: US 10-year yield
- ★ REAL: US 10-year real yield (FRED, daily), the true carrying cost of gold. It is highlighted in gold in every mode because, in my view, it is the single most important driver: when real yields rise, holding gold costs more
- BRENT: oil, the inflation channel
- NDQ: Nasdaq 100, early warning of forced selling
- JPY: USD/JPY, the yen is the safe haven that often moves before gold
With gold
- VIX: fear
- AG: silver, gold's twin, confirms or contradicts the move
- CNH: USD/CNH, China is the largest gold buyer, a weaker yuan supports demand
- TIP: inflation-protected Treasuries ETF, moves opposite to real yields (intraday view of gold's cost)
- INFL: TIP/IEF ratio, intraday proxy for inflation expectations
Columns: change over 15m · 1H · 4H · 1D · 1W · 1M, always measured as "now vs. X time ago". Prices in %, yields in basis points.
HOW TO READ IT
- Cell colour = effect on gold, not direction. Green helps gold, red works against gold, grey is flat. Example: the dollar falling is green, VIX rising is green.
- Final arrows per asset: the first arrow is the intraday direction (15m, 1H, 4H), the second is the background trend (1D, 1W, 1M). Example: DXY ▼▲ means the dollar is falling now, but the background trend is up.
- ⚡ = abnormal spike: the last 15-minute move is more than twice the average of the previous 20 bars. This is usually the answer to "why did gold just move?".
- TOTAL row: verdict for each timeframe (▲▲ strong long, ▲ long, • flat, ▼ short, ▼▼ strong short).
- Final verdict: STRONG LONG / LONG / FLAT / SHORT / STRONG SHORT. Each asset votes with its overall direction; the dollar, the yields, TIP and the real yield count double. If a heavy asset (DXY, yields, TIP, real yield, Brent) spikes against the verdict, the verdict steps down one level, so the table does not push you into a trade right when a strong opposite move is starting.
- ⚠ DIV = divergence: gold is moving in the opposite direction to the macro verdict. In my experience this is one of the most important signals: when gold ignores negative news, there are strong buyers underneath (and vice versa).
DISPLAY MODES
- Full: all six timeframes, optional price column
- Semi (default): price + 15m · 1H · 1D · 1W
- Compact: price + final arrows per asset + verdict, very small
- Super compact: the verdict with spikes and divergence, plus the real yield, for when you are in a trade and only want the wind direction
The table can be placed in any of the nine positions of the chart. Every asset can be switched on or off, its symbol changed, and its relationship to gold set to "Against gold", "With gold" or "Info" (correlations change with the market regime: for example, oil works against gold when the market fears inflation and a hawkish Fed).
ALERTS
Create one alert on the indicator with the condition "Any alert() function call" and you will receive:
- ⚡ spikes, with the asset, the move and whether it is PRO GOLD or AGAINST GOLD
- verdict changes, e.g. "GOLD: from LONG to FLAT"
- ⚠ divergence between gold and the macro verdict
- key level crosses (DXY, US 2Y, Brent), with adjustable levels
NOTES
- Best used on a 15-minute chart or lower, on gold futures (GC, MGC) or spot gold.
- TIP, INFL and VIX only trade during US market hours; outside those hours the last reading is used. REAL is a daily series published once a day.
- The 1W and 1M columns use 5 and 21 trading days.
- Default symbols use widely available TradingView feeds; you can replace them with your broker's symbols in the settings.
This is the context, not the entry signal: I still take my entries from my own levels. The table tells me whether the wind is with me, and when it is time to be careful.
Educational tool, not financial advice. Trading involves risk.
Aquile Reali · Born to fly, born to dare · Be Stable. Be Strong. 🦅
I have written many indicators for gold over the years, but this is the simplest one and, honestly, the one I find most useful while I am actually in a trade.
When I trade gold, the hardest moments are the ones where price moves and I don't know why. Most of the time the answer is outside my chart: the dollar, yields, oil, fear, equities. Gold Drivers puts all of those assets in one small table on the gold chart and tells me, at a glance, whether they are helping gold or working against it, and it alerts me when one of them moves abnormally.
WHAT IT SHOWS
Rows (assets that move gold), grouped by relationship:
Against gold
- DXY: the US dollar
- 2Y: US 2-year yield, the market's bet on the Fed
- 10Y: US 10-year yield
- ★ REAL: US 10-year real yield (FRED, daily), the true carrying cost of gold. It is highlighted in gold in every mode because, in my view, it is the single most important driver: when real yields rise, holding gold costs more
- BRENT: oil, the inflation channel
- NDQ: Nasdaq 100, early warning of forced selling
- JPY: USD/JPY, the yen is the safe haven that often moves before gold
With gold
- VIX: fear
- AG: silver, gold's twin, confirms or contradicts the move
- CNH: USD/CNH, China is the largest gold buyer, a weaker yuan supports demand
- TIP: inflation-protected Treasuries ETF, moves opposite to real yields (intraday view of gold's cost)
- INFL: TIP/IEF ratio, intraday proxy for inflation expectations
Columns: change over 15m · 1H · 4H · 1D · 1W · 1M, always measured as "now vs. X time ago". Prices in %, yields in basis points.
HOW TO READ IT
- Cell colour = effect on gold, not direction. Green helps gold, red works against gold, grey is flat. Example: the dollar falling is green, VIX rising is green.
- Final arrows per asset: the first arrow is the intraday direction (15m, 1H, 4H), the second is the background trend (1D, 1W, 1M). Example: DXY ▼▲ means the dollar is falling now, but the background trend is up.
- ⚡ = abnormal spike: the last 15-minute move is more than twice the average of the previous 20 bars. This is usually the answer to "why did gold just move?".
- TOTAL row: verdict for each timeframe (▲▲ strong long, ▲ long, • flat, ▼ short, ▼▼ strong short).
- Final verdict: STRONG LONG / LONG / FLAT / SHORT / STRONG SHORT. Each asset votes with its overall direction; the dollar, the yields, TIP and the real yield count double. If a heavy asset (DXY, yields, TIP, real yield, Brent) spikes against the verdict, the verdict steps down one level, so the table does not push you into a trade right when a strong opposite move is starting.
- ⚠ DIV = divergence: gold is moving in the opposite direction to the macro verdict. In my experience this is one of the most important signals: when gold ignores negative news, there are strong buyers underneath (and vice versa).
DISPLAY MODES
- Full: all six timeframes, optional price column
- Semi (default): price + 15m · 1H · 1D · 1W
- Compact: price + final arrows per asset + verdict, very small
- Super compact: the verdict with spikes and divergence, plus the real yield, for when you are in a trade and only want the wind direction
The table can be placed in any of the nine positions of the chart. Every asset can be switched on or off, its symbol changed, and its relationship to gold set to "Against gold", "With gold" or "Info" (correlations change with the market regime: for example, oil works against gold when the market fears inflation and a hawkish Fed).
ALERTS
Create one alert on the indicator with the condition "Any alert() function call" and you will receive:
- ⚡ spikes, with the asset, the move and whether it is PRO GOLD or AGAINST GOLD
- verdict changes, e.g. "GOLD: from LONG to FLAT"
- ⚠ divergence between gold and the macro verdict
- key level crosses (DXY, US 2Y, Brent), with adjustable levels
NOTES
- Best used on a 15-minute chart or lower, on gold futures (GC, MGC) or spot gold.
- TIP, INFL and VIX only trade during US market hours; outside those hours the last reading is used. REAL is a daily series published once a day.
- The 1W and 1M columns use 5 and 21 trading days.
- Default symbols use widely available TradingView feeds; you can replace them with your broker's symbols in the settings.
This is the context, not the entry signal: I still take my entries from my own levels. The table tells me whether the wind is with me, and when it is time to be careful.
Educational tool, not financial advice. Trading involves risk.
Aquile Reali · Born to fly, born to dare · Be Stable. Be Strong. 🦅
Phát hành các Ghi chú
RELEASE NOTES (paste in the "Release notes" box when you update the published script)v1.1 – Intraday verdict and compass filter
- New "Verdict horizon" setting. Intraday (default) gives more weight to what is happening now: 15m and 1H weigh 3, 4H and 1D weigh 2, 1W and 1M weigh 1. Swing keeps all timeframes equal, for weekly analysis.
- New compass filter (⚖). The verdict can be STRONG only when the dollar and real yields agree (DXY down + TIP up, or DXY up + TIP down). When they disagree, the verdict is capped and ⚖ is shown. Outside US hours the 10Y yield (inverted) replaces TIP.
- Simpler final arrows: they now show only the effect on gold and its strength (▲ ▲▲ ▲▲▲ green helps gold, ▼ ▼▼ ▼▼▼ red against gold, • neutral).
- ★ REAL (10Y real yield) is now highlighted in gold in every mode and also shown in Super compact mode.
- Price column always visible in Semi mode.
- Horizontal and vertical offsets to place the table exactly where you want it.
- Verdict-change alerts now report when the compass is mixed.

AQUILE REALI – Educational tools by giua64
Thông báo miễn trừ trách nhiệm
Thông tin và các ấn phẩm này không nhằm mục đích, và không cấu thành, lời khuyên hoặc khuyến nghị về tài chính, đầu tư, giao dịch hay các loại khác do TradingView cung cấp hoặc xác nhận. Đọc thêm tại Điều khoản Sử dụng.
AQUILE REALI – Educational tools by giua64
Thông báo miễn trừ trách nhiệm
Thông tin và các ấn phẩm này không nhằm mục đích, và không cấu thành, lời khuyên hoặc khuyến nghị về tài chính, đầu tư, giao dịch hay các loại khác do TradingView cung cấp hoặc xác nhận. Đọc thêm tại Điều khoản Sử dụng.