OPEN-SOURCE SCRIPT
[KTY] Auto Trendlines
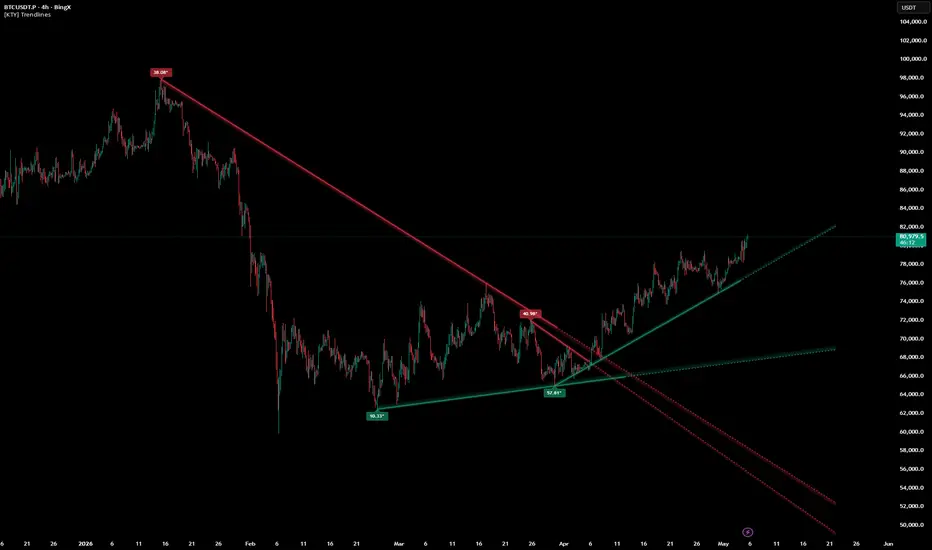
[KTY] Auto Trendlines
Automatically detects and draws diagonal trendlines
based on pivot highs and lows.
━━━━━━━━━━━━━━━━━━━━━━━━━━━━━━━
🔑 Key Features
━━━━━━━━━━━━━━━━━━━━━━━━━━━━━━━
✅ Auto Trendline Detection
Scans recent price action and plots dynamic trendlines
that adapt to ongoing market structure.
Bullish (Green): Connects ascending lows — acts as dynamic support
Bearish (Red): Connects descending highs — acts as dynamic resistance
Each trendline includes a soft glow background
for clearer visual weight.
Confirmed segments are drawn solid,
while projected extensions appear dotted.
✅ Multi-Length System
Two independent trendline groups (L1, L2) run simultaneously,
allowing you to track short-term and longer-term trends
on the same chart.
✅ Smart Anchor Replacement
Trendline starting points are automatically refined
to prevent the line from cutting through candles,
producing cleaner and more reliable trendlines.
✅ Angle Filter
Filters out trendlines that are too flat or too steep,
removing noise and keeping only meaningful structures.
Optional angle labels can be enabled in Debug mode
to help you fine-tune the filter range.
━━━━━━━━━━━━━━━━━━━━━━━━━━━━━━━
📖 How to Use
━━━━━━━━━━━━━━━━━━━━━━━━━━━━━━━
1️⃣ Bounce off bullish trendline → higher chance of trend continuation
2️⃣ Rejection at bearish trendline → higher chance of downward move
3️⃣ Trendline break → potential trend reversal or shift in structure
🔄 Trendline Break
- Broken bullish trendline may signal weakening uptrend
- Broken bearish trendline may signal weakening downtrend
- Watch for retest of the broken trendline before entering
━━━━━━━━━━━━━━━━━━━━━━━━━━━━━━━
🔧 Settings
━━━━━━━━━━━━━━━━━━━━━━━━━━━━━━━
✅ Trendlines
- Show Trendlines: Toggle visibility on/off
- Bullish Color: Customize bullish trendline color (default: green)
- Bearish Color: Customize bearish trendline color (default: red)
🧪 Lengths
- Show L1 / Length 1: Toggle and set short-term pivot length
- Show L2 / Length 2: Toggle and set longer-term pivot length
🎯 Detection
- Anchor Replacement: Refines trendline start points for cleaner lines
- Future Extension Bars: Length of the projected (dotted) extension
- Break Bars Limit: How long broken trendlines remain on the chart
📐 Angle Filter
- Use Angle Filter: Toggle filtering of flat/steep trendlines
- Min Angle / Max Angle: Allowed angle range for valid trendlines
🐞 Debug
- Show Angle Label: Display the angle (°) at each trendline's start point,
useful when adjusting the angle filter range
━━━━━━━━━━━━━━━━━━━━━━━━━━━━━━━
🔔 Alerts
━━━━━━━━━━━━━━━━━━━━━━━━━━━━━━━
🟢 Bullish Trendline Break: Triggers when price closes below a bullish trendline
🔴 Bearish Trendline Break: Triggers when price closes above a bearish trendline
⚡ Any Trendline Break: Triggers on any trendline break event
Setup: ALT + A → Select 【Auto Trendlines】→ Create alert
━━━━━━━━━━━━━━━━━━━━━━━━━━━━━━━
⚠️ Disclaimer
━━━━━━━━━━━━━━━━━━━━━━━━━━━━━━━
This indicator is an analysis tool, not a trade signal service.
Based on historical pivot data — does not guarantee future price reactions.
Strong trends or sudden volatility may invalidate trendlines.
All trading decisions and associated risks are solely your responsibility.
Automatically detects and draws diagonal trendlines
based on pivot highs and lows.
━━━━━━━━━━━━━━━━━━━━━━━━━━━━━━━
🔑 Key Features
━━━━━━━━━━━━━━━━━━━━━━━━━━━━━━━
✅ Auto Trendline Detection
Scans recent price action and plots dynamic trendlines
that adapt to ongoing market structure.
Bullish (Green): Connects ascending lows — acts as dynamic support
Bearish (Red): Connects descending highs — acts as dynamic resistance
Each trendline includes a soft glow background
for clearer visual weight.
Confirmed segments are drawn solid,
while projected extensions appear dotted.
✅ Multi-Length System
Two independent trendline groups (L1, L2) run simultaneously,
allowing you to track short-term and longer-term trends
on the same chart.
✅ Smart Anchor Replacement
Trendline starting points are automatically refined
to prevent the line from cutting through candles,
producing cleaner and more reliable trendlines.
✅ Angle Filter
Filters out trendlines that are too flat or too steep,
removing noise and keeping only meaningful structures.
Optional angle labels can be enabled in Debug mode
to help you fine-tune the filter range.
━━━━━━━━━━━━━━━━━━━━━━━━━━━━━━━
📖 How to Use
━━━━━━━━━━━━━━━━━━━━━━━━━━━━━━━
1️⃣ Bounce off bullish trendline → higher chance of trend continuation
2️⃣ Rejection at bearish trendline → higher chance of downward move
3️⃣ Trendline break → potential trend reversal or shift in structure
🔄 Trendline Break
- Broken bullish trendline may signal weakening uptrend
- Broken bearish trendline may signal weakening downtrend
- Watch for retest of the broken trendline before entering
━━━━━━━━━━━━━━━━━━━━━━━━━━━━━━━
🔧 Settings
━━━━━━━━━━━━━━━━━━━━━━━━━━━━━━━
✅ Trendlines
- Show Trendlines: Toggle visibility on/off
- Bullish Color: Customize bullish trendline color (default: green)
- Bearish Color: Customize bearish trendline color (default: red)
🧪 Lengths
- Show L1 / Length 1: Toggle and set short-term pivot length
- Show L2 / Length 2: Toggle and set longer-term pivot length
🎯 Detection
- Anchor Replacement: Refines trendline start points for cleaner lines
- Future Extension Bars: Length of the projected (dotted) extension
- Break Bars Limit: How long broken trendlines remain on the chart
📐 Angle Filter
- Use Angle Filter: Toggle filtering of flat/steep trendlines
- Min Angle / Max Angle: Allowed angle range for valid trendlines
🐞 Debug
- Show Angle Label: Display the angle (°) at each trendline's start point,
useful when adjusting the angle filter range
━━━━━━━━━━━━━━━━━━━━━━━━━━━━━━━
🔔 Alerts
━━━━━━━━━━━━━━━━━━━━━━━━━━━━━━━
🟢 Bullish Trendline Break: Triggers when price closes below a bullish trendline
🔴 Bearish Trendline Break: Triggers when price closes above a bearish trendline
⚡ Any Trendline Break: Triggers on any trendline break event
Setup: ALT + A → Select 【Auto Trendlines】→ Create alert
━━━━━━━━━━━━━━━━━━━━━━━━━━━━━━━
⚠️ Disclaimer
━━━━━━━━━━━━━━━━━━━━━━━━━━━━━━━
This indicator is an analysis tool, not a trade signal service.
Based on historical pivot data — does not guarantee future price reactions.
Strong trends or sudden volatility may invalidate trendlines.
All trading decisions and associated risks are solely your responsibility.
Mã nguồn mở
Theo đúng tinh thần TradingView, tác giả của tập lệnh này đã công bố nó dưới dạng mã nguồn mở, để các nhà giao dịch có thể xem xét và xác minh chức năng. Chúc mừng tác giả! Mặc dù bạn có thể sử dụng miễn phí, hãy nhớ rằng việc công bố lại mã phải tuân theo Nội quy.

KTY | Kim Thank You 🙏
Professional trading indicators built from years of experience.
📱 Telegram
t.me/official_btc_tracker
🌐 Website
kimthankyou.com
Professional trading indicators built from years of experience.
📱 Telegram
t.me/official_btc_tracker
🌐 Website
kimthankyou.com
Thông báo miễn trừ trách nhiệm
Thông tin và các ấn phẩm này không nhằm mục đích, và không cấu thành, lời khuyên hoặc khuyến nghị về tài chính, đầu tư, giao dịch hay các loại khác do TradingView cung cấp hoặc xác nhận. Đọc thêm tại Điều khoản Sử dụng.
Mã nguồn mở
Theo đúng tinh thần TradingView, tác giả của tập lệnh này đã công bố nó dưới dạng mã nguồn mở, để các nhà giao dịch có thể xem xét và xác minh chức năng. Chúc mừng tác giả! Mặc dù bạn có thể sử dụng miễn phí, hãy nhớ rằng việc công bố lại mã phải tuân theo Nội quy.
KTY | Kim Thank You 🙏
Professional trading indicators built from years of experience.
📱 Telegram
t.me/official_btc_tracker
🌐 Website
kimthankyou.com
Professional trading indicators built from years of experience.
📱 Telegram
t.me/official_btc_tracker
🌐 Website
kimthankyou.com
Thông báo miễn trừ trách nhiệm
Thông tin và các ấn phẩm này không nhằm mục đích, và không cấu thành, lời khuyên hoặc khuyến nghị về tài chính, đầu tư, giao dịch hay các loại khác do TradingView cung cấp hoặc xác nhận. Đọc thêm tại Điều khoản Sử dụng.