OPEN-SOURCE SCRIPT
Kalman Trend Velocity [Probalist Essentials]
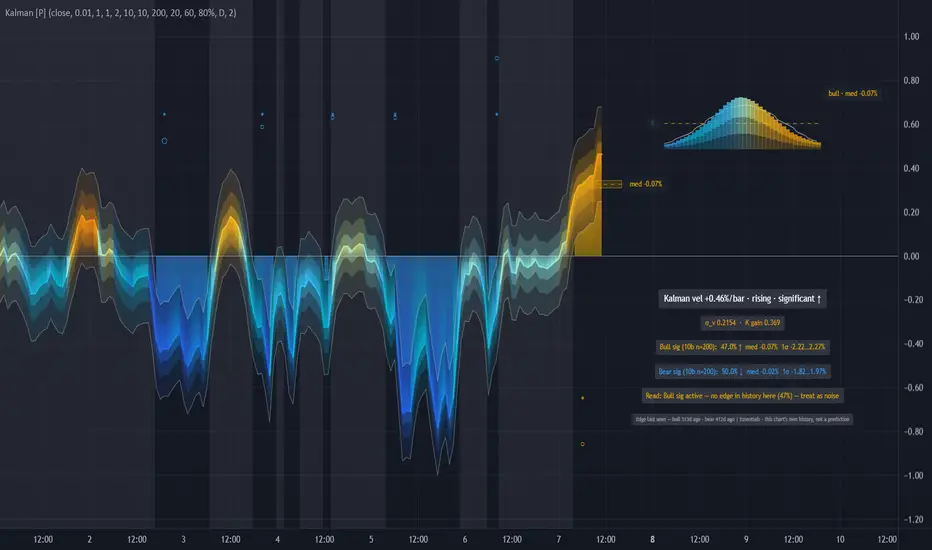
Kalman Trend Velocity tracks the speed of price movement through a real two-state Kalman filter. The velocity estimate comes with its own uncertainty from the filter's covariance matrix — so the indicator can tell you not just which way the trend is moving, but whether that movement is statistically distinguishable from noise. A trend only counts as significant when the velocity minus its own sigma clears zero, shown as the significance shading between the band and the zero line.
This is a momentum tool for traders who want a trend-speed read that respects uncertainty. It suits trend-following entries (wait for significance), exit reads (significance lost = trend may be done), and regime filtering (noise zone = stand aside). The probability panel shows what actually happened after past significance crosses on the chart you're running it on — empirical counting, not theory.
🟡 WHY THIS VERSION
Most 'Kalman' indicators on TV are just EMA variants wearing a different label. This one runs an actual two-state state-space filter: position and velocity estimated together, with a full 2×2 covariance matrix that shrinks when the filter is confident and widens when it's surprised. The velocity's sigma changes bar-to-bar — the band breathes. That's the headline.
The killer extra is the significance zone: the shaded area between the uncertainty band and zero. When velLow > 0 (bull) or velHigh < 0 (bear), the trend is statistically there. When the band straddles zero, it's noise — and the indicator says so plainly. Then there's the probability panel: it counts what happened after every past significance cross on your specific chart and timeframe, shows the win rate, the median move, and the 1-sigma spread. Not a promise. Just what the data said.
🟡 HOW IT WORKS
The filter models price as following a constant-velocity law: position advances by velocity each bar, and velocity persists until the market forces a revision. Two sources of uncertainty feed the model: process noise Q (how much velocity can change per bar) and measurement noise R (how noisy the price reading is). Each bar the filter makes a prediction, then corrects it against the actual close weighted by the Kalman gain — a ratio derived from the model's own uncertainty estimates.
The covariance matrix P carries the filter's self-assessed confidence. After many calm, trending bars the velocity variance p22 shrinks — the filter trusts its model. After a surprise price move the gain jumps and p22 expands — the filter reverts to following the data. The uncertainty band (velocity ± k·sqrt(p22)) visualises this: tight in sustained trends, wide in choppy conditions. The significance cross fires when the LOWER edge of that band clears zero on the bullish side (or the UPPER edge on the bearish side) — meaning even the pessimistic end of the velocity estimate says the trend is real. The filter operates on log-price (×100), which makes the velocity state a percent-per-bar reading and keeps the noise parameters meaningful on any price scale.
🟡 KEY FEATURES
🟡 HOW TO USE
🟡 PAIRS WELL WITH
Kalman velocity tells you trend speed and whether it's statistically real — it doesn't tell you where you are in a structure or whether volume backs the move. A higher-timeframe trend filter (a daily MA slope or a weekly Kalman reading) aligns the direction bias before you act on a significance cross on a shorter chart. A volume read (relative volume or OBV direction) confirms whether the velocity move has participation behind it — velocity without volume is often a low-conviction drift. Key support and resistance levels give the natural targets and reversal zones that the oscillator can't see. The indicator explicitly does not model regime shifts, multi-timeframe confluence scoring, or volatility-adjusted position sizing — those sit in other tools.
Kalman Trend Velocity gives you a trend-speed read that knows its own uncertainty. The significance shading makes the noise/signal distinction visible at a glance. The probability panel adds the chart's own empirical record — not a model, just honest counting. Together they give a cleaner picture of when the trend is real and what the chart's history said about it.
Open source under MPL-2.0. The probability layer describes past signals on your chart — it is a measurement, not a prediction, and nothing here is financial advice.
This is a momentum tool for traders who want a trend-speed read that respects uncertainty. It suits trend-following entries (wait for significance), exit reads (significance lost = trend may be done), and regime filtering (noise zone = stand aside). The probability panel shows what actually happened after past significance crosses on the chart you're running it on — empirical counting, not theory.
🟡 WHY THIS VERSION
Most 'Kalman' indicators on TV are just EMA variants wearing a different label. This one runs an actual two-state state-space filter: position and velocity estimated together, with a full 2×2 covariance matrix that shrinks when the filter is confident and widens when it's surprised. The velocity's sigma changes bar-to-bar — the band breathes. That's the headline.
The killer extra is the significance zone: the shaded area between the uncertainty band and zero. When velLow > 0 (bull) or velHigh < 0 (bear), the trend is statistically there. When the band straddles zero, it's noise — and the indicator says so plainly. Then there's the probability panel: it counts what happened after every past significance cross on your specific chart and timeframe, shows the win rate, the median move, and the 1-sigma spread. Not a promise. Just what the data said.
🟡 HOW IT WORKS
The filter models price as following a constant-velocity law: position advances by velocity each bar, and velocity persists until the market forces a revision. Two sources of uncertainty feed the model: process noise Q (how much velocity can change per bar) and measurement noise R (how noisy the price reading is). Each bar the filter makes a prediction, then corrects it against the actual close weighted by the Kalman gain — a ratio derived from the model's own uncertainty estimates.
The covariance matrix P carries the filter's self-assessed confidence. After many calm, trending bars the velocity variance p22 shrinks — the filter trusts its model. After a surprise price move the gain jumps and p22 expands — the filter reverts to following the data. The uncertainty band (velocity ± k·sqrt(p22)) visualises this: tight in sustained trends, wide in choppy conditions. The significance cross fires when the LOWER edge of that band clears zero on the bullish side (or the UPPER edge on the bearish side) — meaning even the pessimistic end of the velocity estimate says the trend is real. The filter operates on log-price (×100), which makes the velocity state a percent-per-bar reading and keeps the noise parameters meaningful on any price scale.
🟡 KEY FEATURES
- Real 2-state Kalman filter (position + velocity) — not an EMA. Covariance matrix updates every confirmed bar.
- Velocity uncertainty band (± k·σ_v from filter covariance p22) that widens in noise and tightens in trends.
- Significance shading: the zone between the uncertainty band and zero is filled in accent colour only when the trend clears the noise floor.
- Kalman gain K shown in readout — a low K means the filter trusts its own momentum; a high K means it's learning fast.
- Probability panel: kernel-smoothed distribution of forward returns after past significance crosses on the loaded chart. Bull and bear sides tracked separately.
- Wilson-score evidence tiers: five verdict levels from 'recent + long-run backed' to 'no edge here — treat as noise', with an edge clock showing how fresh the current regime is.
- Weighted signal dots with self-calibrating tiers (60th/90th percentile of past signal strength), hover tooltips showing the Read verdict at fire time and the actual outcome once it resolves.
- Probalist heat wave: velocity colour cycles hot/amber/mint/cyan/cold through the official ramp based on velocity magnitude. Glow toggle for visual intensity.
- Family signature — the uncertainty band IS the data: the layers around the velocity wave are the filter's own error estimate, widening in chaos and tightening in clean trends (not decoration)
- Fixed signal lanes: bull dots below the wave, bear dots above — every spaced signal carries its read-at-fire, verdict and completed outcome in the hover tooltip
- Scale-invariant by construction: the filter runs on log-price, so velocity reads as %/bar and the same Q/R defaults behave identically on every symbol — from sub-cent coins to BTC
🟡 HOW TO USE
- Wait for significance: the bullish filter is velocity − σ_v > 0, the bearish filter is velocity + σ_v < 0. The shaded zone confirms it visually — use it as a directional filter for entries rather than acting on every velocity tick.
- Noise zone (no shading, background faint white): the band straddles zero — velocity exists but the filter can't distinguish it from noise. Most false breakouts happen here. Consider standing aside.
- Check the readout for the probability verdict before acting on a cross. 'Recent + long-run backed' means the chart's own history supported follow-through at this setup. 'No edge' means it didn't — useful context even if you still trade it.
- Kalman gain K in the readout row: below ~0.05 the filter is in confident-trend mode; above ~0.3 it's reacting strongly to each bar. High gain + significance cross = the filter just woke up to a new trend.
- Adjust Q and R to fit the instrument: raise Q for volatile assets that change trend speed quickly; raise R for noisy pairs where you want the filter to discount individual bars.
- Costs honesty: the median forward return on short timeframes (5m, 15m) is typically small — often 0.05–0.15% over 10 bars. That does not survive round-trip costs on most venues. The probability read is about direction consistency, not net profit. Use it as a filter alongside a structure read, not as a standalone entry signal.
- Weigh the median move against your round-trip costs — a backed signal with a tiny median doesn't survive fees and spread on most venues; the edge read is about direction, not net profit
- Tune Q (process noise) and R (measurement noise) to your market: higher Q = faster, twitchier filter; higher R = smoother, slower — the K-gain readout shows how much the filter is trusting new bars right now
🟡 PAIRS WELL WITH
Kalman velocity tells you trend speed and whether it's statistically real — it doesn't tell you where you are in a structure or whether volume backs the move. A higher-timeframe trend filter (a daily MA slope or a weekly Kalman reading) aligns the direction bias before you act on a significance cross on a shorter chart. A volume read (relative volume or OBV direction) confirms whether the velocity move has participation behind it — velocity without volume is often a low-conviction drift. Key support and resistance levels give the natural targets and reversal zones that the oscillator can't see. The indicator explicitly does not model regime shifts, multi-timeframe confluence scoring, or volatility-adjusted position sizing — those sit in other tools.
Kalman Trend Velocity gives you a trend-speed read that knows its own uncertainty. The significance shading makes the noise/signal distinction visible at a glance. The probability panel adds the chart's own empirical record — not a model, just honest counting. Together they give a cleaner picture of when the trend is real and what the chart's history said about it.
Open source under MPL-2.0. The probability layer describes past signals on your chart — it is a measurement, not a prediction, and nothing here is financial advice.
Mã nguồn mở
Theo đúng tinh thần TradingView, tác giả của tập lệnh này đã công bố nó dưới dạng mã nguồn mở, để các nhà giao dịch có thể xem xét và xác minh chức năng. Chúc mừng tác giả! Mặc dù bạn có thể sử dụng miễn phí, hãy nhớ rằng việc công bố lại mã phải tuân theo Nội quy.

Thông báo miễn trừ trách nhiệm
Thông tin và các ấn phẩm này không nhằm mục đích, và không cấu thành, lời khuyên hoặc khuyến nghị về tài chính, đầu tư, giao dịch hay các loại khác do TradingView cung cấp hoặc xác nhận. Đọc thêm tại Điều khoản Sử dụng.
Mã nguồn mở
Theo đúng tinh thần TradingView, tác giả của tập lệnh này đã công bố nó dưới dạng mã nguồn mở, để các nhà giao dịch có thể xem xét và xác minh chức năng. Chúc mừng tác giả! Mặc dù bạn có thể sử dụng miễn phí, hãy nhớ rằng việc công bố lại mã phải tuân theo Nội quy.
Thông báo miễn trừ trách nhiệm
Thông tin và các ấn phẩm này không nhằm mục đích, và không cấu thành, lời khuyên hoặc khuyến nghị về tài chính, đầu tư, giao dịch hay các loại khác do TradingView cung cấp hoặc xác nhận. Đọc thêm tại Điều khoản Sử dụng.