OPEN-SOURCE SCRIPT
[Kpt-Ahab] HeatMap Fusion
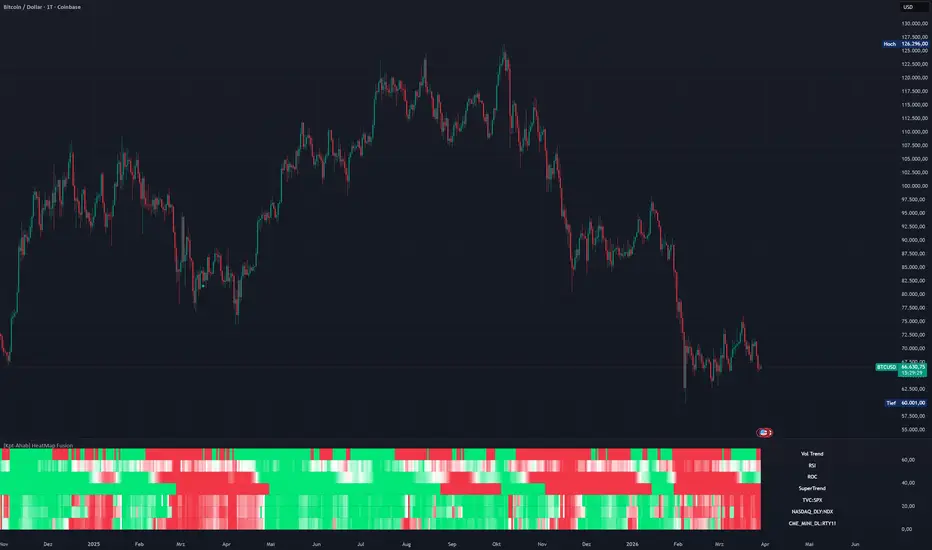
What is “HeatMap Fusion”?
HeatMap Fusion merges RSI, Volume Trend, ROC and an enhanced SuperTrend into one stacked heat-map. Smooth colour gradients reveal—at a glance—whether each component is bullish, neutral, or bearish, without cluttering the chart with multiple separate panes.
Key Features
Multi-indicator heat-map
Three symbols with volume- or price-based colouring.
RSI, ROC and SuperTrend share the same colour scale → instant market-breadth read-out.
View switcher – choose RSI, ROC, SuperTrend, Volume SMA, Up/Down Volume or ALL from a single dropdown.
Six colour schemes (red⇅green, purple⇅blue, etc.) for both light and dark layouts.
Optional RSI divergence detection.
Heikin-Ashi–driven SuperTrend plus Rapid Volatility Trend lines.
Performance-optimised – only three request.security() calls for the selected symbols.
Inputs
Group Core settings
Indicator Layer to display
Color Scheme (Heatmap) 6 presets
Symbol 3 tickers, volume/price mode, look-back length
RSI Period, MA type, BB width, divergence flag
Volume Trend SMA length, up/down columns
ROC Period & intensity threshold
SuperTrend Two ATR sets, Heikin-Ashi on/off
(Every parameter is commented inside the script.)
How to Use
Add the script to any chart.
Set SymCal to on when your symbol has real volume data (futures, ETFs, equities).
Replace the three default tickers with your own—e.g. ES1!, ZB1!, CL1! for a macro setup.
Pick a colour scheme; Purple ⇅ Blue looks great on dark backgrounds.
Choose ALL for the full heat-map with labels, or isolate any single layer via the dropdown.
Notes
The heat-map lives in the main pane on fixed Y-bands (0 – 70). Do not enable Auto-Fit scaling.
If a symbol has no volume, SymCal = on yields no colouring—switch it off to fall back to price-based gradients.
HeatMap Fusion merges RSI, Volume Trend, ROC and an enhanced SuperTrend into one stacked heat-map. Smooth colour gradients reveal—at a glance—whether each component is bullish, neutral, or bearish, without cluttering the chart with multiple separate panes.
Key Features
Multi-indicator heat-map
Three symbols with volume- or price-based colouring.
RSI, ROC and SuperTrend share the same colour scale → instant market-breadth read-out.
View switcher – choose RSI, ROC, SuperTrend, Volume SMA, Up/Down Volume or ALL from a single dropdown.
Six colour schemes (red⇅green, purple⇅blue, etc.) for both light and dark layouts.
Optional RSI divergence detection.
Heikin-Ashi–driven SuperTrend plus Rapid Volatility Trend lines.
Performance-optimised – only three request.security() calls for the selected symbols.
Inputs
Group Core settings
Indicator Layer to display
Color Scheme (Heatmap) 6 presets
Symbol 3 tickers, volume/price mode, look-back length
RSI Period, MA type, BB width, divergence flag
Volume Trend SMA length, up/down columns
ROC Period & intensity threshold
SuperTrend Two ATR sets, Heikin-Ashi on/off
(Every parameter is commented inside the script.)
How to Use
Add the script to any chart.
Set SymCal to on when your symbol has real volume data (futures, ETFs, equities).
Replace the three default tickers with your own—e.g. ES1!, ZB1!, CL1! for a macro setup.
Pick a colour scheme; Purple ⇅ Blue looks great on dark backgrounds.
Choose ALL for the full heat-map with labels, or isolate any single layer via the dropdown.
Notes
The heat-map lives in the main pane on fixed Y-bands (0 – 70). Do not enable Auto-Fit scaling.
If a symbol has no volume, SymCal = on yields no colouring—switch it off to fall back to price-based gradients.
Mã nguồn mở
Theo đúng tinh thần TradingView, tác giả của tập lệnh này đã công bố nó dưới dạng mã nguồn mở, để các nhà giao dịch có thể xem xét và xác minh chức năng. Chúc mừng tác giả! Mặc dù bạn có thể sử dụng miễn phí, hãy nhớ rằng việc công bố lại mã phải tuân theo Nội quy.

Thông báo miễn trừ trách nhiệm
Thông tin và các ấn phẩm này không nhằm mục đích, và không cấu thành, lời khuyên hoặc khuyến nghị về tài chính, đầu tư, giao dịch hay các loại khác do TradingView cung cấp hoặc xác nhận. Đọc thêm tại Điều khoản Sử dụng.
Mã nguồn mở
Theo đúng tinh thần TradingView, tác giả của tập lệnh này đã công bố nó dưới dạng mã nguồn mở, để các nhà giao dịch có thể xem xét và xác minh chức năng. Chúc mừng tác giả! Mặc dù bạn có thể sử dụng miễn phí, hãy nhớ rằng việc công bố lại mã phải tuân theo Nội quy.
Thông báo miễn trừ trách nhiệm
Thông tin và các ấn phẩm này không nhằm mục đích, và không cấu thành, lời khuyên hoặc khuyến nghị về tài chính, đầu tư, giao dịch hay các loại khác do TradingView cung cấp hoặc xác nhận. Đọc thêm tại Điều khoản Sử dụng.