WizTrader Range Grid
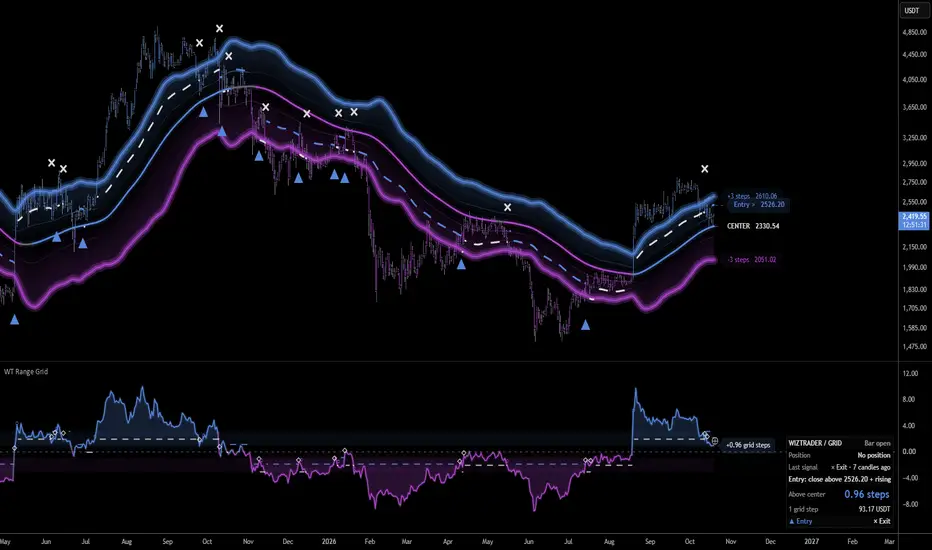
WizTrader Range Grid maps price around an adaptive center. A volatility-scaled grid on the price chart and a synchronized oscillator show the same distance. A confirmed entry/exit cycle tracks a virtual Long or no position. It sends no broker orders and has no Short mode.
Reading the chart
The dashboard states the actual virtual position, last confirmed signal and next condition. Bar open describes the candle's changing readings; Bar closed identifies its confirmed state. All entry/exit events wait for candle close. The dashboard describes the latest available candle, not a historical crosshair selection or a broker account.
Grid steps and oscillator
One grid step is one gap between adjacent grid lines. The oscillator is (close - center) / spacing. Zero means price equals the center. +1 means one line spacing above it; -1 means one below.
For example, with center 100 and spacing 2, price 106 is +3 steps and price 96 is -2 steps. These are not percentages, probabilities or measured order flow. Readings are unbounded and can exceed the outer displayed lines. The oscillator adds no independent smoothing or candle delay.
Price movement, movement of the center and changing spacing can all change the reading. A larger distance alone does not prove a stronger trend or a likely reversal.
Adaptive calculation
Center Response defaults to 75 chart candles. The center uses a damped price response whose coefficient changes with path efficiency: net movement relative to the total absolute close-to-close movement over the response horizon.
Spacing combines fast and slow exponentially smoothed True Range through their geometric mean, applies Grid Spacing Multiplier and smooths the logarithm through two EMA stages. Range Response defaults to 14 and Spacing Smoothness to 6. Spacing has a two-tick minimum. This is a custom range measure, not conventional ATR. Only the current chart's native OHLC data is used.
The implementation combines this shared geometry with a stateful grid-step cycle and a Previous Grid price test for entries. Detailed diagnostics explain changes in the reference system. These are specific design choices using established techniques; no market-first mathematics or universally superior signals are claimed.
Entry and exit cycle
The cycle begins without a position. While Flat, it tracks the lowest confirmed grid step reached within the configured step limits. The next step above that anchor is the entry base. After an observed setup at or below the base, BUY requires all of the following at candle close:
Movement of the current grid alone cannot satisfy the price test. The visible entry reference is therefore not the only requirement; the dashboard reports missing conditions. The pending reference breaks when its role or base changes. On an entry/exit candle, a separate dashed segment completes the old reference at the threshold actually tested. It connects the previous candle’s pending threshold to its tested value on the event candle. The next reference is separate, including when BUY and SELL occur on adjacent candles. Up to 80 such endings are retained per view, independently of marker visibility. The event tooltip also records the tested threshold. These segments do not represent simulated fills.
While Long, the cycle tracks the highest confirmed grid step reached. Its exit base is one step below that peak. SELL occurs on the first confirmed close strictly below the base minus Signal Buffer. There is no extra persistence candle or rising-close veto on exits. SELL closes Long; it never opens Short.
Signal Buffer defaults to 0.10 step, not 10% of price. With an anchor at -3, the entry reference is -1.90. Reaching +3 while Long sets the exit reference to +1.90. Exact equality does not trigger an entry or exit. Displayed prices are rounded to the minimum tick; comparisons use unrounded references.
Grid Levels / Signal Depth defaults to three and changes both displayed lines and the cycle's step limits. With three levels and buffer 0.10, the highest exit reference remains +1.90 steps even when readings extend much higher. There are no additional hidden progress steps. This option is not merely a visibility setting.
The exit base index cannot decrease during a Long, but its price follows the moving center and spacing and can decrease. It is not a fixed-price stop or guaranteed fill. Grid movement can contribute to exits.
BUY and SELL alternate. A gap across several levels produces at most one position event. There are no duplicate entries during a Long, exits while Flat or same-calculation exit/re-entry. Starting above the upper base does not invent an immediate entry; the setup must first arm. Initialization does not reconstruct an earlier excursion.
Display settings
Simple is the default dashboard detail. Detailed adds a location meter, center/spacing diagnostics, the Price/Center/Spacing change split and the latest grid crossing. Display Detail also changes Focus price-label detail. It does not change calculation settings or signals.
Signal Size controls historical symbols; Dashboard / Label Text Size controls table and current-value text. Entry/exit symbols contain no words and use one glyph per event. Their anchors sit one tick outside the event candle's wick, with text extending outward. Marker height is display spacing, not execution price. Up to 80 position events are retained; the oldest entry/exit pairs are removed together. The latest entry can still be open.
Focus price labels show the center, outer levels and the separate entry/exit reference. Detailed Focus also includes +/-1. All shows every displayed base level; Off hides current price tags. Right-edge horizontal spacing is for legibility, not future projection. Base-level tags retain their above/below-center colors; the entry reference is blue and the exit reference uses the same neutral foreground color as ×, adapting to the chart theme.
Depth & Glow controls surfaces and line halos. Each outer boundary uses three concentric strokes on the same price path: a wide halo, a brighter inner glow and a thin full-color contour. Subtle uses widths 12/6/2 with halo/inner opacity 10%/24%; Balanced uses 12/6/2 at 18%/42%; Strong uses 16/8/2 at 25%/52%. Widths are Pine linewidth settings. The inner stroke adds visible luminosity around the contour; it is not an additional calculated price level. Strength is a display setting, not a trend-strength or price-proximity measure.
Turning chart Depth & Glow off removes both glow strokes and restores the previous plain outer contour. Outer glow and chart grid surfaces require Grid Lines to be on. The center halo requires Center Line as well as chart Depth & Glow.
In the oscillator, Glow Strength adjusts the main gradient, curve halo and extension surfaces together. Curve-halo opacity is 7%/11%/15% for Subtle/Balanced/Strong; extension-surface opacity is 3%/5%/7%. Balanced retains the previous appearance. These settings add no smoothing or signal delay.
Maximum opacity per main gradient layer is 6%/7% for Subtle, 12%/14% for Balanced and 20%/22% for Strong, referring to chart/oscillator respectively. Layers fade to transparency at center. Combined opacity can differ where layers overlap. Position symbols have no second glow copy.
Optional bar coloring
Color Bars by Grid Position is off by default. When enabled, it uses the same current distance color as the oscillator: gray inside Neutral Zone, blue above it and purple below it. Neutral Zone defaults to +/-0.15 grid step, including its boundaries, and is adjustable from 0 to 0.50 under Appearance.
Gray means near the center, not that the entire market is sideways. Setting the zone to zero gives gray only at exact equality. Colors do not report candle direction, an entry or a virtual position. Numerical readings and signal rules are unchanged. Open-candle colors can change; Off or insufficient initialization data leaves native chart colors untouched.
Optional grid details
All three optional displays are off by default and selectable in either Simple or Detailed:
Grid Crossing Level (Alerts) selects Inner +/-1, Middle the middle displayed level rounded up, or Outer +/-Grid Levels. With three levels, Middle is +/-2. With two levels, Middle equals Inner (+/-1); with one level, all three choices equal +/-1. This choice affects context events only. Selected crossing references use dotted chart lines when context-marker displays are enabled. Optional context markers use an outer lane when a visible position marker occupies the same side.
The Detailed location meter is bounded by displayed outer levels; the numerical distance is not clipped. Price + Center + Spacing contributions sum to the unrounded distance change under a defined algebraic convention. They are explanatory accounting terms, not independent confirmations or unique causal attribution.
Six named alerts
Create the desired named condition directly and choose Once Per Bar Close. All six conditions wait for confirmed close. Grid crossings can result from price or grid movement; gaps can trigger two context alerts together. All six default messages include the distance in grid steps. Their placeholder refers to the named Grid steps plot, which supplies the same data even when the oscillator is hidden. Its title in the Data Window uses the same terminology.
Hiding markers, changing Simple/Detailed or hiding oscillator contents does not disable alerts. Existing TradingView alerts retain their saved code and settings: recreate them after updates or relevant input changes.
Getting started
Scope and limitations
Use standard price charts; synthetic chart types are rejected. Open-candle prices, colors and grid readings are provisional, while virtual position events commit only at close. Hiding oscillator contents does not remove its native pane. Labels, tables and other objects can overlap at some zoom levels or with other indicators.
The indicator does not simulate fills, sizing or strategy performance. Minimum initialization does not remove all recursive-filter seed effects; available history and data revisions can change recalculated results. The settings are response choices, not demonstrated optima. No profitability, universal suitability or unrestricted non-repainting claim is made.
Reading the chart
- Blue grid lines and shading are above the center; purple lines and shading are below it. These colors describe location, not an open position.
- ▲ Entry: Records a confirmed Long entry on its event candle.
- × Exit: Records a confirmed exit from that Long. It does not mean Short entry.
- The blue dashed line is the next moving entry reference; the neutral dashed line is the next exit reference. Its right-edge tag says Entry > or Exit <. It is a pending threshold, not an event marker or forecast.
- The center line has its own rising/falling/flat slope color. Its slope can differ from price's location around it.
The dashboard states the actual virtual position, last confirmed signal and next condition. Bar open describes the candle's changing readings; Bar closed identifies its confirmed state. All entry/exit events wait for candle close. The dashboard describes the latest available candle, not a historical crosshair selection or a broker account.
Grid steps and oscillator
One grid step is one gap between adjacent grid lines. The oscillator is (close - center) / spacing. Zero means price equals the center. +1 means one line spacing above it; -1 means one below.
For example, with center 100 and spacing 2, price 106 is +3 steps and price 96 is -2 steps. These are not percentages, probabilities or measured order flow. Readings are unbounded and can exceed the outer displayed lines. The oscillator adds no independent smoothing or candle delay.
Price movement, movement of the center and changing spacing can all change the reading. A larger distance alone does not prove a stronger trend or a likely reversal.
Adaptive calculation
Center Response defaults to 75 chart candles. The center uses a damped price response whose coefficient changes with path efficiency: net movement relative to the total absolute close-to-close movement over the response horizon.
Spacing combines fast and slow exponentially smoothed True Range through their geometric mean, applies Grid Spacing Multiplier and smooths the logarithm through two EMA stages. Range Response defaults to 14 and Spacing Smoothness to 6. Spacing has a two-tick minimum. This is a custom range measure, not conventional ATR. Only the current chart's native OHLC data is used.
The implementation combines this shared geometry with a stateful grid-step cycle and a Previous Grid price test for entries. Detailed diagnostics explain changes in the reference system. These are specific design choices using established techniques; no market-first mathematics or universally superior signals are claimed.
Entry and exit cycle
The cycle begins without a position. While Flat, it tracks the lowest confirmed grid step reached within the configured step limits. The next step above that anchor is the entry base. After an observed setup at or below the base, BUY requires all of the following at candle close:
- Price is strictly above the base plus Signal Buffer in the current grid.
- The close is higher than the previous close.
- The same close also exceeds that buffered step measured in the previous candle's unchanged grid.
Movement of the current grid alone cannot satisfy the price test. The visible entry reference is therefore not the only requirement; the dashboard reports missing conditions. The pending reference breaks when its role or base changes. On an entry/exit candle, a separate dashed segment completes the old reference at the threshold actually tested. It connects the previous candle’s pending threshold to its tested value on the event candle. The next reference is separate, including when BUY and SELL occur on adjacent candles. Up to 80 such endings are retained per view, independently of marker visibility. The event tooltip also records the tested threshold. These segments do not represent simulated fills.
While Long, the cycle tracks the highest confirmed grid step reached. Its exit base is one step below that peak. SELL occurs on the first confirmed close strictly below the base minus Signal Buffer. There is no extra persistence candle or rising-close veto on exits. SELL closes Long; it never opens Short.
Signal Buffer defaults to 0.10 step, not 10% of price. With an anchor at -3, the entry reference is -1.90. Reaching +3 while Long sets the exit reference to +1.90. Exact equality does not trigger an entry or exit. Displayed prices are rounded to the minimum tick; comparisons use unrounded references.
Grid Levels / Signal Depth defaults to three and changes both displayed lines and the cycle's step limits. With three levels and buffer 0.10, the highest exit reference remains +1.90 steps even when readings extend much higher. There are no additional hidden progress steps. This option is not merely a visibility setting.
The exit base index cannot decrease during a Long, but its price follows the moving center and spacing and can decrease. It is not a fixed-price stop or guaranteed fill. Grid movement can contribute to exits.
BUY and SELL alternate. A gap across several levels produces at most one position event. There are no duplicate entries during a Long, exits while Flat or same-calculation exit/re-entry. Starting above the upper base does not invent an immediate entry; the setup must first arm. Initialization does not reconstruct an earlier excursion.
Display settings
Simple is the default dashboard detail. Detailed adds a location meter, center/spacing diagnostics, the Price/Center/Spacing change split and the latest grid crossing. Display Detail also changes Focus price-label detail. It does not change calculation settings or signals.
Signal Size controls historical symbols; Dashboard / Label Text Size controls table and current-value text. Entry/exit symbols contain no words and use one glyph per event. Their anchors sit one tick outside the event candle's wick, with text extending outward. Marker height is display spacing, not execution price. Up to 80 position events are retained; the oldest entry/exit pairs are removed together. The latest entry can still be open.
Focus price labels show the center, outer levels and the separate entry/exit reference. Detailed Focus also includes +/-1. All shows every displayed base level; Off hides current price tags. Right-edge horizontal spacing is for legibility, not future projection. Base-level tags retain their above/below-center colors; the entry reference is blue and the exit reference uses the same neutral foreground color as ×, adapting to the chart theme.
Depth & Glow controls surfaces and line halos. Each outer boundary uses three concentric strokes on the same price path: a wide halo, a brighter inner glow and a thin full-color contour. Subtle uses widths 12/6/2 with halo/inner opacity 10%/24%; Balanced uses 12/6/2 at 18%/42%; Strong uses 16/8/2 at 25%/52%. Widths are Pine linewidth settings. The inner stroke adds visible luminosity around the contour; it is not an additional calculated price level. Strength is a display setting, not a trend-strength or price-proximity measure.
Turning chart Depth & Glow off removes both glow strokes and restores the previous plain outer contour. Outer glow and chart grid surfaces require Grid Lines to be on. The center halo requires Center Line as well as chart Depth & Glow.
In the oscillator, Glow Strength adjusts the main gradient, curve halo and extension surfaces together. Curve-halo opacity is 7%/11%/15% for Subtle/Balanced/Strong; extension-surface opacity is 3%/5%/7%. Balanced retains the previous appearance. These settings add no smoothing or signal delay.
Maximum opacity per main gradient layer is 6%/7% for Subtle, 12%/14% for Balanced and 20%/22% for Strong, referring to chart/oscillator respectively. Layers fade to transparency at center. Combined opacity can differ where layers overlap. Position symbols have no second glow copy.
Optional bar coloring
Color Bars by Grid Position is off by default. When enabled, it uses the same current distance color as the oscillator: gray inside Neutral Zone, blue above it and purple below it. Neutral Zone defaults to +/-0.15 grid step, including its boundaries, and is adjustable from 0 to 0.50 under Appearance.
Gray means near the center, not that the entire market is sideways. Setting the zone to zero gives gray only at exact equality. Colors do not report candle direction, an entry or a virtual position. Numerical readings and signal rules are unchanged. Open-candle colors can change; Off or insufficient initialization data leaves native chart colors untouched.
Optional grid details
All three optional displays are off by default and selectable in either Simple or Detailed:
- Crossing Markers on Chart: ○ for an outward crossing of the selected boundary; ◇ for a return. A gap through both boundaries is combined in one marker's tooltip. These are context events, not position signals.
- Crossing Markers in Oscillator: the same confirmed context events. Requires the Oscillator display to be on.
- Previous-Grid Comparison: a last-bar ⊕ shows the current close measured in the previous candle's unchanged grid. The dotted connector compares it with the current reading. Requires usable current/prior values and the Oscillator display. It is not a forecast or signal.
Grid Crossing Level (Alerts) selects Inner +/-1, Middle the middle displayed level rounded up, or Outer +/-Grid Levels. With three levels, Middle is +/-2. With two levels, Middle equals Inner (+/-1); with one level, all three choices equal +/-1. This choice affects context events only. Selected crossing references use dotted chart lines when context-marker displays are enabled. Optional context markers use an outer lane when a visible position marker occupies the same side.
The Detailed location meter is bounded by displayed outer levels; the numerical distance is not clipped. Price + Center + Spacing contributions sum to the unrounded distance change under a defined algebraic convention. They are explanatory accounting terms, not independent confirmations or unique causal attribution.
Six named alerts
- Signal - BUY: Confirmed virtual Long entry.
- Signal - SELL: Confirmed virtual Long exit.
- Grid - Upper Expansion: Confirmed distance crossing above the selected upper boundary.
- Grid - Lower Expansion: Confirmed distance crossing below the selected lower boundary.
- Grid - Return from Upper: Confirmed distance crossing back below the upper boundary.
- Grid - Return from Lower: Confirmed distance crossing back above the lower boundary.
Create the desired named condition directly and choose Once Per Bar Close. All six conditions wait for confirmed close. Grid crossings can result from price or grid movement; gaps can trigger two context alerts together. All six default messages include the distance in grid steps. Their placeholder refers to the named Grid steps plot, which supplies the same data even when the oscillator is hidden. Its title in the Data Window uses the same terminology.
Hiding markers, changing Simple/Detailed or hiding oscillator contents does not disable alerts. Existing TradingView alerts retain their saved code and settings: recreate them after updates or relevant input changes.
Getting started
- Use a standard Candles or Bars chart and begin with the default calculation settings.
- Read Position and Last signal in the dashboard. A blue grid area alone does not indicate an open Long.
- Use the Next Entry / Exit Line together with the dashboard's next condition. An entry requires more than crossing the line.
- Choose the named alerts you need and set them to Once Per Bar Close.
- Enable optional crossing markers or Previous-Grid Comparison when you want the additional context.
Scope and limitations
Use standard price charts; synthetic chart types are rejected. Open-candle prices, colors and grid readings are provisional, while virtual position events commit only at close. Hiding oscillator contents does not remove its native pane. Labels, tables and other objects can overlap at some zoom levels or with other indicators.
The indicator does not simulate fills, sizing or strategy performance. Minimum initialization does not remove all recursive-filter seed effects; available history and data revisions can change recalculated results. The settings are response choices, not demonstrated optima. No profitability, universal suitability or unrestricted non-repainting claim is made.

WizTrader develops TradingView indicators for trend, market structure, momentum and trading signals. Explore our free scripts and WizTrader Pro (invite-only). More indicators are in development.
Website: wiztrader.io
Website: wiztrader.io
Thông báo miễn trừ trách nhiệm
Thông tin và các ấn phẩm này không nhằm mục đích, và không cấu thành, lời khuyên hoặc khuyến nghị về tài chính, đầu tư, giao dịch hay các loại khác do TradingView cung cấp hoặc xác nhận. Đọc thêm tại Điều khoản Sử dụng.
WizTrader develops TradingView indicators for trend, market structure, momentum and trading signals. Explore our free scripts and WizTrader Pro (invite-only). More indicators are in development.
Website: wiztrader.io
Website: wiztrader.io
Thông báo miễn trừ trách nhiệm
Thông tin và các ấn phẩm này không nhằm mục đích, và không cấu thành, lời khuyên hoặc khuyến nghị về tài chính, đầu tư, giao dịch hay các loại khác do TradingView cung cấp hoặc xác nhận. Đọc thêm tại Điều khoản Sử dụng.