OPEN-SOURCE SCRIPT
Cập nhật RSI Bands (KenshinC)
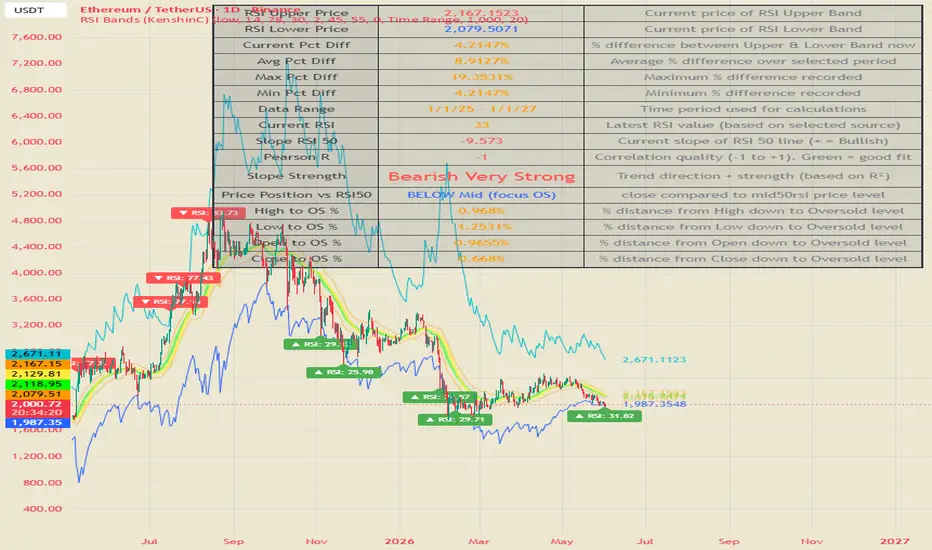
─────────────────────────────────────────────────────────────
// RSI BANDS (KenshinC)
// ─────────────────────────────────────────────────────────────
//
// ███████╗██████╗ ███████╗ ██████╗ █████╗ ███╗ ██╗██████╗ ███████╗
// ██╔════╝██╔══██╗██╔════╝ ██╔══██╗██╔══██╗████╗ ██║██╔══██╗██╔════╝
// ███████╗██████╔╝█████╗ ██████╔╝███████║██╔██╗ ██║██║ ██║███████╗
// ╚════██║██╔══██╗██╔══╝ ██╔══██╗██╔══██║██║╚██╗██║██║ ██║╚════██║
// ███████║██║ ██║███████╗ ██████╔╝██║ ██║██║ ╚████║██████╔╝███████║
// ╚══════╝╚═╝ ╚═╝╚══════╝ ╚═════╝ ╚═╝ ╚═╝╚═╝ ╚═══╝╚═════╝ ╚══════╝
//
// IMPORTANT DISCLAIMER:
// This indicator is provided for EDUCATIONAL and TECHNICAL ANALYSIS purposes only.
// It is NOT financial advice, investment recommendation, or trading signal.
// Trading involves substantial risk of loss. Always do your own research and
// consult with a qualified financial advisor before making any investment decisions.
// The author assumes no responsibility for any losses incurred from using this tool.
//
// ─────────────────────────────────────────────────────────────
// INTRODUCTION
// ─────────────────────────────────────────────────────────────
// RSI Bands (KenshinC) is a powerful RSI-to-Price transformation indicator.
// Instead of showing RSI in a separate pane, it converts RSI levels into actual
// price levels directly on the main chart. This creates dynamic support/resistance
// zones based on RSI logic.
//
// Key Features:
// • Custom RSI Source (Close/High/Low)
// • Fast RSI Length (default 8)
// • Multiple Overbought & Oversold bands with multiplier
// • RSI 50 equilibrium line
// • Custom RSI Upper (55) & Lower (45) bands
// • Real-time Statistics Table
// • Touch detection labels (▲/▼)
// • Labels on price scale with track price option
//
// ─────────────────────────────────────────────────────────────
// HOW TO USE
// ─────────────────────────────────────────────────────────────
// 1. Market Context:
// - Price near RSI Lower Band (45) or Oversold zones → Potential buy area
// - Price near RSI Upper Band (55) or Overbought zones → Potential sell area
// - Price around RSI 50 → Ranging / equilibrium market
//
// 2. Band Strength:
// - Further bands (OB3–OB8 / OS3–OS8) represent stronger extremes.
//
// 3. Statistics Table:
// - Shows current & historical % distance between Upper and Lower bands
// - Helps quantify mean-reversion or breakout potential
//
// 4. Trading Styles:
// - Mean Reversion: Buy at deep OS, Sell at deep OB
// - Breakout: Strong break above OB1 or below OS1
//
// ─────────────────────────────────────────────────────────────
// RECOMMENDED SETTINGS
// ─────────────────────────────────────────────────────────────
// • Scalping / Day Trading → Timeframe 5m–1H, RSI Length 8
// • Swing Trading → Timeframe 4H–Daily
// • Enable "Labels on Price Scale" + "Track Price" for cleaner look
// • Keep Statistics Table ON for better decision making
//
// ─────────────────────────────────────────────────────────────
// SETTINGS GUIDE (Main Groups)
// ─────────────────────────────────────────────────────────────
// 1. Main Settings
// - RSI Source, RSI Length, Overbought (85), Oversold (15)
//
// 2. RSI Levels Settings
// - Multiplier (1.5): Controls spacing of extra bands
// - RSI 50, RSI Lower Band (45), RSI Upper Band (55)
//
// 3. Outputs
// - Labels, Touch Labels, Statistics Table, History Method
//
// ─────────────────────────────────────────────────────────────
// FINAL REMINDER
// ─────────────────────────────────────────────────────────────
// This script is for educational and analytical purposes only.
// Past performance is not indicative of future results.
// Trade at your own risk.
//
// Created by: KenshinC
// Version: 1.0
// RSI BANDS (KenshinC)
// ─────────────────────────────────────────────────────────────
//
// ███████╗██████╗ ███████╗ ██████╗ █████╗ ███╗ ██╗██████╗ ███████╗
// ██╔════╝██╔══██╗██╔════╝ ██╔══██╗██╔══██╗████╗ ██║██╔══██╗██╔════╝
// ███████╗██████╔╝█████╗ ██████╔╝███████║██╔██╗ ██║██║ ██║███████╗
// ╚════██║██╔══██╗██╔══╝ ██╔══██╗██╔══██║██║╚██╗██║██║ ██║╚════██║
// ███████║██║ ██║███████╗ ██████╔╝██║ ██║██║ ╚████║██████╔╝███████║
// ╚══════╝╚═╝ ╚═╝╚══════╝ ╚═════╝ ╚═╝ ╚═╝╚═╝ ╚═══╝╚═════╝ ╚══════╝
//
// IMPORTANT DISCLAIMER:
// This indicator is provided for EDUCATIONAL and TECHNICAL ANALYSIS purposes only.
// It is NOT financial advice, investment recommendation, or trading signal.
// Trading involves substantial risk of loss. Always do your own research and
// consult with a qualified financial advisor before making any investment decisions.
// The author assumes no responsibility for any losses incurred from using this tool.
//
// ─────────────────────────────────────────────────────────────
// INTRODUCTION
// ─────────────────────────────────────────────────────────────
// RSI Bands (KenshinC) is a powerful RSI-to-Price transformation indicator.
// Instead of showing RSI in a separate pane, it converts RSI levels into actual
// price levels directly on the main chart. This creates dynamic support/resistance
// zones based on RSI logic.
//
// Key Features:
// • Custom RSI Source (Close/High/Low)
// • Fast RSI Length (default 8)
// • Multiple Overbought & Oversold bands with multiplier
// • RSI 50 equilibrium line
// • Custom RSI Upper (55) & Lower (45) bands
// • Real-time Statistics Table
// • Touch detection labels (▲/▼)
// • Labels on price scale with track price option
//
// ─────────────────────────────────────────────────────────────
// HOW TO USE
// ─────────────────────────────────────────────────────────────
// 1. Market Context:
// - Price near RSI Lower Band (45) or Oversold zones → Potential buy area
// - Price near RSI Upper Band (55) or Overbought zones → Potential sell area
// - Price around RSI 50 → Ranging / equilibrium market
//
// 2. Band Strength:
// - Further bands (OB3–OB8 / OS3–OS8) represent stronger extremes.
//
// 3. Statistics Table:
// - Shows current & historical % distance between Upper and Lower bands
// - Helps quantify mean-reversion or breakout potential
//
// 4. Trading Styles:
// - Mean Reversion: Buy at deep OS, Sell at deep OB
// - Breakout: Strong break above OB1 or below OS1
//
// ─────────────────────────────────────────────────────────────
// RECOMMENDED SETTINGS
// ─────────────────────────────────────────────────────────────
// • Scalping / Day Trading → Timeframe 5m–1H, RSI Length 8
// • Swing Trading → Timeframe 4H–Daily
// • Enable "Labels on Price Scale" + "Track Price" for cleaner look
// • Keep Statistics Table ON for better decision making
//
// ─────────────────────────────────────────────────────────────
// SETTINGS GUIDE (Main Groups)
// ─────────────────────────────────────────────────────────────
// 1. Main Settings
// - RSI Source, RSI Length, Overbought (85), Oversold (15)
//
// 2. RSI Levels Settings
// - Multiplier (1.5): Controls spacing of extra bands
// - RSI 50, RSI Lower Band (45), RSI Upper Band (55)
//
// 3. Outputs
// - Labels, Touch Labels, Statistics Table, History Method
//
// ─────────────────────────────────────────────────────────────
// FINAL REMINDER
// ─────────────────────────────────────────────────────────────
// This script is for educational and analytical purposes only.
// Past performance is not indicative of future results.
// Trade at your own risk.
//
// Created by: KenshinC
// Version: 1.0
Phát hành các Ghi chú
### Major Algorithm & Feature Changes (v2.0 vs Old Version)**1. New Core Feature: Linear Regression Slope of RSI 50**
- Added full Linear Regression calculation on the RSI 50 price line.
- Slope plotted as histogram (Green = Bullish, Red = Bearish).
- Added Pearson R (trend strength) and Slope Strength label ("Very Strong / Strong / Weak").
- This is the biggest upgrade — transforms the indicator into a momentum + trend strength tool.
**2. Major Performance Improvement**
- Old version: Created new labels every bar (caused lag).
- New version: Uses `var label` + efficient `update_label()` function → much faster and lighter.
**3. Better Extended Levels Control**
- Old: Extended levels always shown if RSI Levels enabled.
- New: Separate toggles for Extended Overbought (OB1-OB8) and Oversold (OS1-OS8).
**4. Enhanced Statistics Table**
- Added Slope RSI 50, Pearson R, and Slope Strength rows.
- Added professional frame (`frame_width = 2`, `frame_color = color.black`).
- Cleaner layout with better color coding.
**5. Code Quality**
- All titles, tooltips, and comments now in English.
- Better organized input groups.
- Removed redundant code and fixed bugs.
**6. Visual Enhancements**
- Slope background coloring.
- Optional Regression Line.
- Smoother label handling.
---
### How to Use the OLD Version (User Guide)
**Indicator Name:** RSI Bands (KenshinC)
#### 1. Purpose
This indicator converts RSI levels (85, 50, 15, etc.) into **dynamic price levels** on the chart using a special transformation based on Wilder's RSI formula. It shows clear support/resistance zones directly on price action.
#### 2. Key Settings
**Main Settings:**
- **RSI Source**: `close` / `high` / `low` (default: close)
- **RSI Length**: Default 8 (highly responsive)
- **Overbought**: Default 85
- **Oversold**: Default 15
**RSI Levels Settings:**
- **RSI Levels**: Main switch for all levels
- **Background Only**: Hide lines, show only background (if using bgcolor)
- **RSI 50**: Show midline
- **RSI Lower Band** (default 45) & **RSI Upper Band** (default 55)
- **Multiplier** (default 1.5): Distance for extended levels OB1–OB8 & OS1–OS8
**Outputs Settings:**
- **labels**: Show price values next to levels
- **labels on price scale**: Move labels to price axis
- **trackprice**: Labels follow current price
- **Label offset**: Adjust label position
- **Show Touch Labels**: Display ▲ / ▼ when price touches OB1 or OS1
- **Show Statistics Table**: Powerful summary panel
#### 3. Trading Style
- **Bullish Zone**: Price above RSI Upper Band (55) + climbing toward OB levels
- **Bearish Zone**: Price below RSI Lower Band (45) + dropping toward OS levels
- **Reversal Signals**: Price reaching extended levels (OB3–OB8 or OS3–OS8)
- **Breakout**: Strong move breaking OB1 or OS1
- Use **Touch Labels** (▼ ▲) as visual entry/exit alerts
- Check **Statistics Table** for average band range (great for targets)
#### 4. Best Practices
- Works excellent on low timeframes (1m to 15m) with Length = 8
- Increase Multiplier (2.0–3.0) in strong trending markets
- Use "Background Only" when chart is crowded
- Combine with candlestick patterns or volume for higher accuracy
---
**Note:**
The new **v2.0** keeps all original functions while adding professional Slope Analysis and much better performance.
Phát hành các Ghi chú
**🟠 OVERVIEW**The **RSI Bands (KenshinC) ** is a significantly upgraded version of the original RSI Bands indicator. While the core concept remains the conversion of RSI levels into dynamic price bands on the chart, the new version introduces major improvements in usability, analytical depth, and visual feedback.
The most notable updates include enhanced **Touch Labels** that now display actual RSI values, a completely redesigned **Statistics Table** with conditional OHLC percentage analysis, improved slope strength interpretation, and better-organized professional documentation. These changes transform the indicator from a visual RSI band tool into a more comprehensive decision-support system for identifying overbought/oversold zones, trend strength, and price positioning relative to key RSI-derived levels.
**🟠 KEY UPDATES vs OLD VERSION**
| Area | Old Version | New Version (Professional) | Improvement |
|------|-------------|---------------------------|-----------|
| **Touch Labels** | Only showed ▼ / ▲ symbols | Shows **"▼ RSI: xx.xx"** and **"▲ RSI: xx.xx"** with actual RSI value | Much more informative at a glance |
| **Statistics Table** | Simple 2-column, fixed rows | **3-column dynamic table** with descriptions + Conditional OHLC % | Significantly more powerful |
| **OHLC Analysis** | Only showed Pct Open → OB1/OS1 | **Conditional OHLC %** (High/Low/Open/Close) based on price position vs RSI 50 Mid | New intelligent logic |
| **Slope Strength** | Basic "Very Strong / Strong / Weak" | Shows **direction + strength** (e.g. "Bullish Very Strong") | Clearer trend context |
| **RSI Length Default** | 14 | **8** | More responsive to price action |
| **Documentation** | Basic | Professional structure with clear sections | Easier to understand and use |
**🟠 CONCEPTS & ALGORITHMS**
**RSI-to-Price Conversion (`rsi_to_plot`)**
The indicator uses a custom algorithm to project RSI levels (such as 85, 50, 15, and extended levels) onto the price scale. It reconstructs the price that would theoretically produce a specific RSI value by using exponential moving averages of upward and downward price changes. This allows traders to see traditional RSI overbought/oversold levels directly on the price chart as dynamic bands.
**Linear Regression Slope + Pearson R (`calcSlope` + `calcDev`)**
The script calculates the slope of the RSI 50 line over a user-defined period using a custom linear regression method. It also computes the **Pearson correlation coefficient (R)** to measure how well price action fits the regression line. The slope indicates trend direction of RSI momentum, while Pearson R quantifies the **strength and reliability** of that trend. Higher absolute R values suggest more consistent directional movement.
**Conditional OHLC Percentage Logic**
A new intelligent feature in the Professional Edition. The indicator first checks whether the current price is **above or below** the RSI 50 Mid line. Based on this position, it automatically calculates the percentage distance from High, Low, Open, and Close to either the Oversold zone (when below Mid) or Overbought zone (when above Mid). This helps traders quickly assess how much room price has to move toward key RSI levels.
**Historical Statistics Array**
The script maintains a rolling array of percentage differences between the Upper and Lower RSI bands. It can calculate average, maximum, and minimum values over either a fixed number of bars or a custom time range, giving context to whether current band width is expanding or contracting historically.
**🟠 FEATURES**
- **Dynamic RSI Bands converted to price** with extended Overbought (OB1–OB8) and Oversold (OS1–OS8) levels.
- **Touch Labels with RSI Value** — Clearly marks when price touches key levels and displays the current RSI reading.
- **Advanced Statistics Table** — Includes current/average/max/min band percentage difference, current RSI, Slope RSI 50, Pearson R, and Slope Strength classification.
- **Conditional OHLC % Analysis** — Shows percentage distance from OHLC to OB/OS levels, automatically switching logic based on price position relative to RSI 50.
- **RSI 50 Linear Regression Slope + Pearson R** — Measures momentum direction and trend strength of the RSI midline.
- **Professional English Interface** — Clean input grouping, detailed tooltips, and structured documentation.
**🟠 HOW TO USE**
1. **Identify Key Zones**
Watch how price interacts with the main Overbought (rsi_top) and Oversold (rsi_bot) bands, as well as the extended levels (OB1–OB8 / OS1–OS8). These act as dynamic reaction zones.
2. **Use Touch Labels for Precision**
When price touches OB1 or OS1, the label now shows the exact RSI value at that moment. This helps confirm whether the touch occurred in truly overbought or oversold territory.
3. **Analyze Trend Strength with Slope + Pearson R**
- Positive slope + high Pearson R → Strong bullish RSI momentum.
- Negative slope + high Pearson R → Strong bearish RSI momentum.
- Low Pearson R → Weak or noisy trend (avoid relying heavily on slope).
4. **Use Conditional OHLC % for Positioning**
Check the Statistics Table to see how far High, Low, Open, and Close are from the relevant OB/OS zone. This is especially useful for assessing risk/reward when price is approaching extreme levels.
5. **Monitor Band Width (Pct Diff)**
Use the Average, Max, and Min Pct Diff in the table to understand whether the RSI bands are currently wide (high volatility) or narrow (low volatility) compared to recent history.
6. **Best Practices**
- Combine with price action or market structure for higher probability setups.
- Use the slope background coloring as a quick visual filter for overall RSI momentum bias.
- Adjust the RSI Length (default 8 in new version) according to your trading timeframe — shorter lengths are more sensitive.
**🟠 CONCLUSION**
The **RSI Bands (KenshinC) Professional Edition** represents a substantial evolution from the previous version. While preserving the core RSI-to-Price conversion engine, it significantly enhances usability and analytical value through improved Touch Labels, a much more powerful conditional Statistics Table, and clearer trend strength interpretation.
The new version is better suited for active traders who want not only visual RSI bands but also **quantitative context** — such as how far price is from key levels, how strong the current RSI trend is, and how current band conditions compare historically. It maintains a clean professional interface while delivering deeper insights into RSI behavior on the price chart.
Mã nguồn mở
Theo đúng tinh thần TradingView, tác giả của tập lệnh này đã công bố nó dưới dạng mã nguồn mở, để các nhà giao dịch có thể xem xét và xác minh chức năng. Chúc mừng tác giả! Mặc dù bạn có thể sử dụng miễn phí, hãy nhớ rằng việc công bố lại mã phải tuân theo Nội quy.

Made with passion by KenshinC
Thông báo miễn trừ trách nhiệm
Thông tin và các ấn phẩm này không nhằm mục đích, và không cấu thành, lời khuyên hoặc khuyến nghị về tài chính, đầu tư, giao dịch hay các loại khác do TradingView cung cấp hoặc xác nhận. Đọc thêm tại Điều khoản Sử dụng.
Mã nguồn mở
Theo đúng tinh thần TradingView, tác giả của tập lệnh này đã công bố nó dưới dạng mã nguồn mở, để các nhà giao dịch có thể xem xét và xác minh chức năng. Chúc mừng tác giả! Mặc dù bạn có thể sử dụng miễn phí, hãy nhớ rằng việc công bố lại mã phải tuân theo Nội quy.
Made with passion by KenshinC
Thông báo miễn trừ trách nhiệm
Thông tin và các ấn phẩm này không nhằm mục đích, và không cấu thành, lời khuyên hoặc khuyến nghị về tài chính, đầu tư, giao dịch hay các loại khác do TradingView cung cấp hoặc xác nhận. Đọc thêm tại Điều khoản Sử dụng.