SITREP The Key Levels
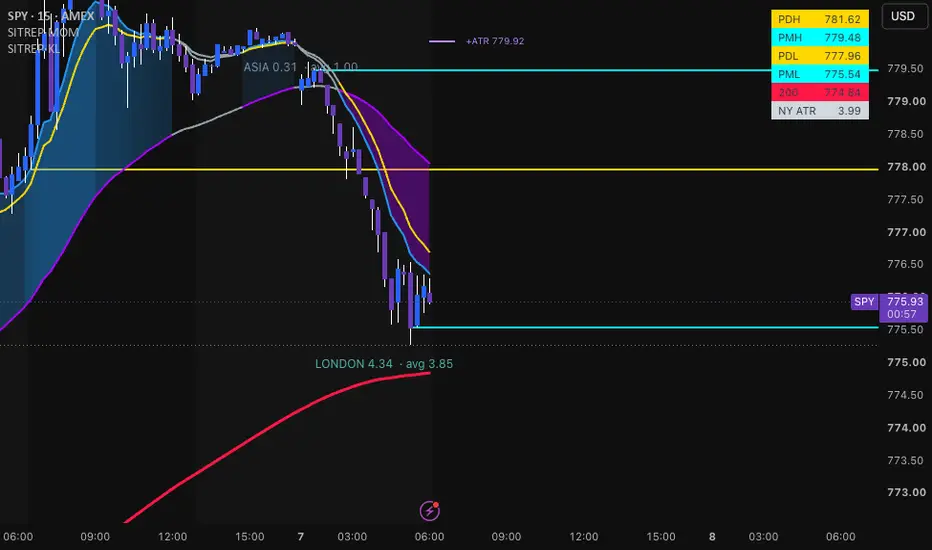
SITREP Key Levels draws the handful of reference prices an intraday index trader checks before the New York open, and nothing else. It plots the prior day's high and low from the regular NYSE session using wick extremes, the pre-market high and low using candle body extremes on a 15-minute basis, the previous futures week's high and low (off by default), and a 200 EMA. Every line runs clean to the price axis, and a compact legend pinned to the top right lists each level with its price, sorted top to bottom the same way the chart reads. Because the legend is anchored to the pane and not to bars, it sits in the same place on every timeframe and zoom.
The level construction is deliberate. Prior-day levels use wicks because a break of the full prior-day range is what matters. Pre-market levels use bodies because a wick shows price reaching without acceptance, and the 15-minute basis means the pre-market high and low read identically on a 2-minute execution chart and a 15-minute prep chart. The previous-week levels follow the true futures week, from the Sunday 18:00 ET open through Friday's close. All session windows are set in New York time and can be changed in the settings.
The indicator also measures how far the market normally travels in the New York morning. "NY ATR" in the legend is the average high-to-low range of the 09:30 to 12:00 ET session over the last 20 days, with today excluded, so the number holds still through the session and represents what was normal going into the open. Two short purple lines show that distance above and below price. They follow price from 09:00 to 09:30 ET, then freeze at the opening price. Since the average covers the whole session range, each line marks the outer bound of a normal morning in one direction: a level inside the lines is within ordinary reach, and a level beyond them needs a larger-than-average session. Optional on-chart labels show the Asia, London and New York ranges against their averages, and the New York label compares the remaining average range with the distance to the next level in the direction of the move.
To use it, add it to an intraday chart with extended hours turned on, since the pre-market, Asia and London windows need that data. Check where the levels sit relative to the purple lines during preparation, then draw your own zones around the levels you care about. The script only knows the levels it draws, so the range read does not account for hand-drawn zones. Averages describe past sessions and do not predict the next one, and trend days regularly exceed them. This is a reference and planning tool for educational use, not a signal generator or financial advice.
The level construction is deliberate. Prior-day levels use wicks because a break of the full prior-day range is what matters. Pre-market levels use bodies because a wick shows price reaching without acceptance, and the 15-minute basis means the pre-market high and low read identically on a 2-minute execution chart and a 15-minute prep chart. The previous-week levels follow the true futures week, from the Sunday 18:00 ET open through Friday's close. All session windows are set in New York time and can be changed in the settings.
The indicator also measures how far the market normally travels in the New York morning. "NY ATR" in the legend is the average high-to-low range of the 09:30 to 12:00 ET session over the last 20 days, with today excluded, so the number holds still through the session and represents what was normal going into the open. Two short purple lines show that distance above and below price. They follow price from 09:00 to 09:30 ET, then freeze at the opening price. Since the average covers the whole session range, each line marks the outer bound of a normal morning in one direction: a level inside the lines is within ordinary reach, and a level beyond them needs a larger-than-average session. Optional on-chart labels show the Asia, London and New York ranges against their averages, and the New York label compares the remaining average range with the distance to the next level in the direction of the move.
To use it, add it to an intraday chart with extended hours turned on, since the pre-market, Asia and London windows need that data. Check where the levels sit relative to the purple lines during preparation, then draw your own zones around the levels you care about. The script only knows the levels it draws, so the range read does not account for hand-drawn zones. Averages describe past sessions and do not predict the next one, and trend days regularly exceed them. This is a reference and planning tool for educational use, not a signal generator or financial advice.

Thông báo miễn trừ trách nhiệm
Thông tin và các ấn phẩm này không nhằm mục đích, và không cấu thành, lời khuyên hoặc khuyến nghị về tài chính, đầu tư, giao dịch hay các loại khác do TradingView cung cấp hoặc xác nhận. Đọc thêm tại Điều khoản Sử dụng.
Thông báo miễn trừ trách nhiệm
Thông tin và các ấn phẩm này không nhằm mục đích, và không cấu thành, lời khuyên hoặc khuyến nghị về tài chính, đầu tư, giao dịch hay các loại khác do TradingView cung cấp hoặc xác nhận. Đọc thêm tại Điều khoản Sử dụng.