OPEN-SOURCE SCRIPT
Cập nhật RSI Core Levels Heatmap [BigBeluga]
🔵 OVERVIEW
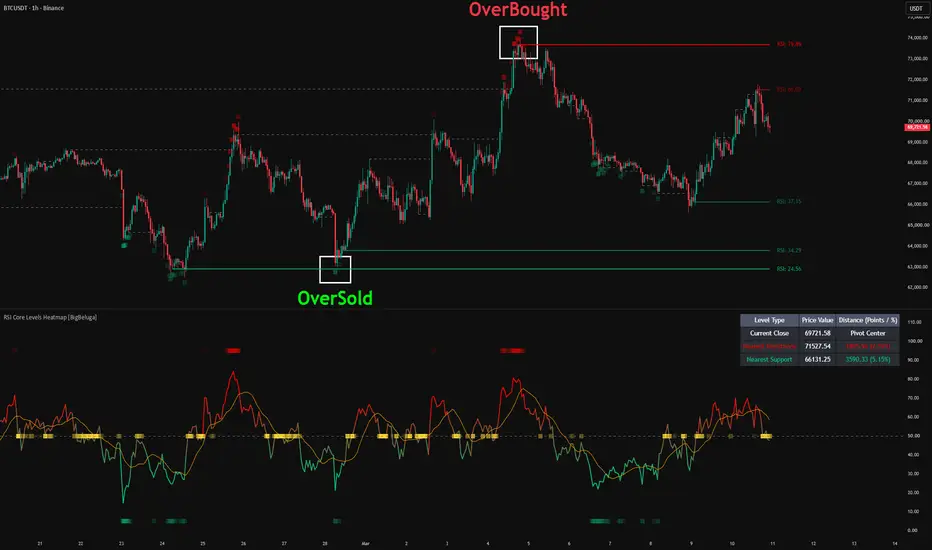
The RSI Core Levels Heatmap [BigBeluga] turns the standard Relative Strength Index (RSI) indicator into powerful support and resistance lines drawn directly on your main price chart. Instead of forcing you to constantly look down at a separate oscillator window, this script automatically finds hidden momentum levels and projects them right where you trade, helping you spot key reversal floors and ceilings instantly.
🔵 FEATURES
The system uses a smart layout tracking engine to map momentum without cluttering your screen:
1 — Momentum-Mapped Support & Resistance Lines
2 — No-Clutter Overlap Protection Logic
Pine Script®
3 — Active Line Lifecycle & FIFO System
Pine Script®
4 — Gradient Heatmap Ribbon & Proximity Dashboard
🔵 HOW TO USE
Using this simple multi-layer blueprint helps you manage setups step-by-step:
🔵 NOTES
Why this implementation is unique:
The RSI Core Levels Heatmap [BigBeluga] turns the standard Relative Strength Index (RSI) indicator into powerful support and resistance lines drawn directly on your main price chart. Instead of forcing you to constantly look down at a separate oscillator window, this script automatically finds hidden momentum levels and projects them right where you trade, helping you spot key reversal floors and ceilings instantly.
🔵 FEATURES
The system uses a smart layout tracking engine to map momentum without cluttering your screen:
1 — Momentum-Mapped Support & Resistance Lines
- Signal Line Crossover Alerts: The indicator tracks momentum changes using a smooth Signal Line Length. When the raw RSI line crosses above or below this signal line, it triggers a setup.
- Smart Price Capture: The moment a crossover happens, the engine looks back at the last 10 candles. If it is a bullish bounce, it finds the low price; if it is a bearish drop, it grabs the high price.
- Direct Chart Overlay: It takes those key prices and draws clean support or resistance lines right on your main chart with clear labels.
2 — No-Clutter Overlap Protection Logic
- Collision Checker: To stop your chart from looking like a messy spiderweb, the indicator checks if a new line is being drawn too close to an old one.
- Duplicate Blocking: If a new level lands directly on top of an existing active zone, the script blocks it automatically to keep your trading area perfectly clean.
3 — Active Line Lifecycle & FIFO System
- Automatic Extension: All active, unbroken support and resistance lines automatically stretch forward on every new candle so they stay fresh.
- Broken Line Changes: When price actions breaks through a line, the script instantly changes its style to a thin, grey dashed line and stops tracking it. This shows you exactly where historical levels failed.
- Levels Heat Color: Each support and resistance level color intense is based on the rsi value at the moment level was created.
- FIFO (First-In, First-Out) Lag Protection: To keep your TradingView running fast without any lag, you can set a Max Active Levels & Labels limit. When you reach this cap, the oldest lines drop off the chart first (First-In, First-Out) to make room for new ones.
4 — Gradient Heatmap Ribbon & Proximity Dashboard
- Color-Changing Ribbon blocks: The bottom sub-pane features a smooth gradient ribbon that tracks market extremes. It lights up bright green during deep oversold conditions, bright red when overbought, and turns yellow during tight consolidations (Show Midline Squeeze Zone).
- Distance Telemetry HUD Table: A clean on-screen table calculates exactly how close the current price is to your nearest active support or resistance level in points and exact percentages.
🔵 HOW TO USE
Using this simple multi-layer blueprint helps you manage setups step-by-step:
- Trading Reversals and Bounces: Watch the chart when price falls down toward a green support line. If the Dashboard Table shows the distance getting very close to 0% and the bottom ribbon is flashing deep green (oversold), look for a long bounce trade off the level.
- Managing Risk and Trailing Stops: If you enter long at a support line, use that level as your risk floor. If price flushes below it, the indicator will instantly turn the line grey and dashed, letting you know the setup is invalid and it is time to cut the trade.
- Spotting Squeeze Breakouts: When the bottom ribbon stays yellow, it means the market is squeezing sideways. Watch your distance dashboard closely; when price breaks out of the squeeze and flies toward your outer lines, you can ride the explosive momentum expansion.
🔵 NOTES
Why this implementation is unique:
- It saves screen space by turning abstract momentum data from an oscillator below into highly accurate, tradeable price targets up on your main chart.
- The overlap blocker prevents multiple lines from bunching together, keeping your chart clean and easy to read.
- The automated FIFO memory cleaning system makes sure the script stays fast and lightweight, no matter how many bars are loaded on your chart.
Phát hành các Ghi chú
- RSI length addedMã nguồn mở
Theo đúng tinh thần TradingView, tác giả của tập lệnh này đã công bố nó dưới dạng mã nguồn mở, để các nhà giao dịch có thể xem xét và xác minh chức năng. Chúc mừng tác giả! Mặc dù bạn có thể sử dụng miễn phí, hãy nhớ rằng việc công bố lại mã phải tuân theo Nội quy.

🌐 bigbeluga.org/tv - Get access to our powerful tools & indicators.
🔵 Learn More -> docs.bigbeluga.org/
🔵 Join Discord -> go.bigbeluga.org/k65q9bfqfu
All content provided by BigBeluga is for educational purposes only
🔵 Learn More -> docs.bigbeluga.org/
🔵 Join Discord -> go.bigbeluga.org/k65q9bfqfu
All content provided by BigBeluga is for educational purposes only
Thông báo miễn trừ trách nhiệm
Thông tin và các ấn phẩm này không nhằm mục đích, và không cấu thành, lời khuyên hoặc khuyến nghị về tài chính, đầu tư, giao dịch hay các loại khác do TradingView cung cấp hoặc xác nhận. Đọc thêm tại Điều khoản Sử dụng.
Mã nguồn mở
Theo đúng tinh thần TradingView, tác giả của tập lệnh này đã công bố nó dưới dạng mã nguồn mở, để các nhà giao dịch có thể xem xét và xác minh chức năng. Chúc mừng tác giả! Mặc dù bạn có thể sử dụng miễn phí, hãy nhớ rằng việc công bố lại mã phải tuân theo Nội quy.
🌐 bigbeluga.org/tv - Get access to our powerful tools & indicators.
🔵 Learn More -> docs.bigbeluga.org/
🔵 Join Discord -> go.bigbeluga.org/k65q9bfqfu
All content provided by BigBeluga is for educational purposes only
🔵 Learn More -> docs.bigbeluga.org/
🔵 Join Discord -> go.bigbeluga.org/k65q9bfqfu
All content provided by BigBeluga is for educational purposes only
Thông báo miễn trừ trách nhiệm
Thông tin và các ấn phẩm này không nhằm mục đích, và không cấu thành, lời khuyên hoặc khuyến nghị về tài chính, đầu tư, giao dịch hay các loại khác do TradingView cung cấp hoặc xác nhận. Đọc thêm tại Điều khoản Sử dụng.