Uptrend Dip Finder
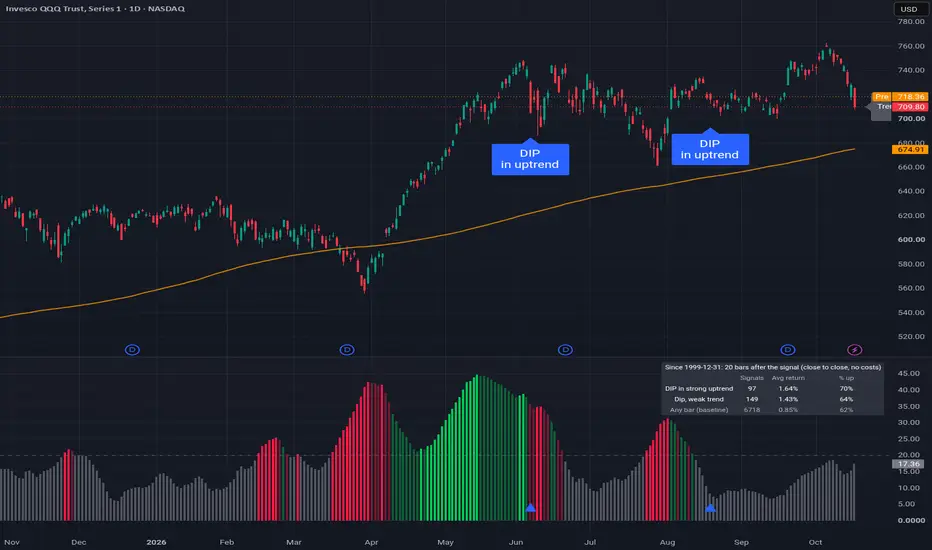
Uptrend Dip Finder answers two simple questions on any chart:
1) Is there a real trend right now, and is it getting stronger or weaker?
2) Is this pullback a dip inside a strong uptrend?
HOW TO READ IT
- Columns in the pane = trend strength (ADX). Bright green = STRONG UPTREND, light green = UPTREND, FADING, grey = NO TREND (chop), light red = DOWNTREND, FADING, bright red = STRONG DOWNTREND.
- Dashed line = trend threshold (ADX 20). Below it the market is choppy.
- Blue "DIP in uptrend" label on the price chart: a short, sharp sell-off (2-period RSI below 10) while price is above its 200-day average AND the trend was strong and up 5 bars before the dip started.
- Orange line on price = 200-day average. Below it the script gives no dip signals at all.
- Optional small blue dot (off by default): the same dip when the trend was weak before it.
- "Now" readout at the right edge: current trend state, trend age in bars, ADX and whether a dip is active.
- Stats table: what happened 20 bars after each dip on this chart, next to any random bar.
WHAT IS NEW COMPARED WITH THE ORIGINAL
The original "ADX and DI" plots three lines and a threshold. This version keeps that math intact and adds:
1. Five plain-word trend states with coloured columns, including whether the trend is strengthening or fading (ADX rising or falling).
2. Trend age: how many bars the current direction has lasted.
3. A dip finder that only works inside a strong uptrend: above the 200-day average, the trend strong and up before the pullback, and a short-term oversold reading.
4. A live status readout, and alerts for dips and trend changes (strong uptrend starts, chop starts, strong downtrend starts).
5. A built-in stats table that scores past signals against any bar on the same chart, so you can check it on your own symbol.
6. Pine v6. No repainting: it uses only the chart's own data and signals are final at the bar close. Original DI lines can be shown, and the original SMA smoothing can be switched to Wilder's RMA.
SETTINGS
- ADX / DI length 14 and threshold 20 (original defaults), smoothing "Original (SMA of DX)".
- Uptrend filter (fixed): 200-bar SMA, trend strong and up 5 bars before the dip. Dip: 2-period RSI below 10.
- Stats: 20 bars after the signal, counted from 2000.
HONEST RESULTS
My own test on daily QQQ, 2000 to Oct 2026, close to close, no costs:
- 98 "DIP in uptrend" signals, about 4 a year. 20 bars later: average +1.5%, up 70% of the time. Any bar: +0.8%, up 62%.
- Since 2010 that edge is gone: +1.0% after a signal vs +1.5% for any bar (up 70% vs 67%). Most of the advantage came from before 2010.
- 2022 had no signals at all. The filter kept it out of that bear market, and it also gives you nothing to do in one.
- The worst result 20 bars after a signal was -22.8%. A dip can keep falling after the label.
- Buying the next open after each signal and selling 20 bars later, with costs, made +177% in total since 2000 while invested about 21% of the days. Buy-and-hold made about +790%. Since 2010: +88% vs about +1,670%. This is a timing aid for adding to a trend, not a stand-alone system.
Results change with the symbol, period and settings.
NOTES AND LIMITS
- Built for daily charts of liquid indexes, ETFs and large stocks. Fast intraday charts give many more, noisier signals.
- ADX lags by design. The trend state describes the market; on its own it did not predict the next 20 bars in my tests.
CREDIT
The DI+, DI- and ADX code is the open-source "ADX and DI" by BeikabuOyaji (MPL 2.0). Thank you. ADX and DMI are J. Welles Wilder's classic indicators. The 2-period RSI dip rule above the 200-day average was popularised by Larry Connors. This is a Pine v6 rewrite with new trend states, a dip finder, stats and alerts.
Next: I'm combining these free tools into one simple regime indicator that scales out near greedy peaks and buys back when fear fades. I'll publish it here with the full backtest, good and bad.
DISCLAIMER
For education only. This is not financial advice. Past results and backtests do not guarantee future results.
1) Is there a real trend right now, and is it getting stronger or weaker?
2) Is this pullback a dip inside a strong uptrend?
HOW TO READ IT
- Columns in the pane = trend strength (ADX). Bright green = STRONG UPTREND, light green = UPTREND, FADING, grey = NO TREND (chop), light red = DOWNTREND, FADING, bright red = STRONG DOWNTREND.
- Dashed line = trend threshold (ADX 20). Below it the market is choppy.
- Blue "DIP in uptrend" label on the price chart: a short, sharp sell-off (2-period RSI below 10) while price is above its 200-day average AND the trend was strong and up 5 bars before the dip started.
- Orange line on price = 200-day average. Below it the script gives no dip signals at all.
- Optional small blue dot (off by default): the same dip when the trend was weak before it.
- "Now" readout at the right edge: current trend state, trend age in bars, ADX and whether a dip is active.
- Stats table: what happened 20 bars after each dip on this chart, next to any random bar.
WHAT IS NEW COMPARED WITH THE ORIGINAL
The original "ADX and DI" plots three lines and a threshold. This version keeps that math intact and adds:
1. Five plain-word trend states with coloured columns, including whether the trend is strengthening or fading (ADX rising or falling).
2. Trend age: how many bars the current direction has lasted.
3. A dip finder that only works inside a strong uptrend: above the 200-day average, the trend strong and up before the pullback, and a short-term oversold reading.
4. A live status readout, and alerts for dips and trend changes (strong uptrend starts, chop starts, strong downtrend starts).
5. A built-in stats table that scores past signals against any bar on the same chart, so you can check it on your own symbol.
6. Pine v6. No repainting: it uses only the chart's own data and signals are final at the bar close. Original DI lines can be shown, and the original SMA smoothing can be switched to Wilder's RMA.
SETTINGS
- ADX / DI length 14 and threshold 20 (original defaults), smoothing "Original (SMA of DX)".
- Uptrend filter (fixed): 200-bar SMA, trend strong and up 5 bars before the dip. Dip: 2-period RSI below 10.
- Stats: 20 bars after the signal, counted from 2000.
HONEST RESULTS
My own test on daily QQQ, 2000 to Oct 2026, close to close, no costs:
- 98 "DIP in uptrend" signals, about 4 a year. 20 bars later: average +1.5%, up 70% of the time. Any bar: +0.8%, up 62%.
- Since 2010 that edge is gone: +1.0% after a signal vs +1.5% for any bar (up 70% vs 67%). Most of the advantage came from before 2010.
- 2022 had no signals at all. The filter kept it out of that bear market, and it also gives you nothing to do in one.
- The worst result 20 bars after a signal was -22.8%. A dip can keep falling after the label.
- Buying the next open after each signal and selling 20 bars later, with costs, made +177% in total since 2000 while invested about 21% of the days. Buy-and-hold made about +790%. Since 2010: +88% vs about +1,670%. This is a timing aid for adding to a trend, not a stand-alone system.
Results change with the symbol, period and settings.
NOTES AND LIMITS
- Built for daily charts of liquid indexes, ETFs and large stocks. Fast intraday charts give many more, noisier signals.
- ADX lags by design. The trend state describes the market; on its own it did not predict the next 20 bars in my tests.
CREDIT
The DI+, DI- and ADX code is the open-source "ADX and DI" by BeikabuOyaji (MPL 2.0). Thank you. ADX and DMI are J. Welles Wilder's classic indicators. The 2-period RSI dip rule above the 200-day average was popularised by Larry Connors. This is a Pine v6 rewrite with new trend states, a dip finder, stats and alerts.
Next: I'm combining these free tools into one simple regime indicator that scales out near greedy peaks and buys back when fear fades. I'll publish it here with the full backtest, good and bad.
DISCLAIMER
For education only. This is not financial advice. Past results and backtests do not guarantee future results.

Thông báo miễn trừ trách nhiệm
Thông tin và các ấn phẩm này không nhằm mục đích, và không cấu thành, lời khuyên hoặc khuyến nghị về tài chính, đầu tư, giao dịch hay các loại khác do TradingView cung cấp hoặc xác nhận. Đọc thêm tại Điều khoản Sử dụng.
Thông báo miễn trừ trách nhiệm
Thông tin và các ấn phẩm này không nhằm mục đích, và không cấu thành, lời khuyên hoặc khuyến nghị về tài chính, đầu tư, giao dịch hay các loại khác do TradingView cung cấp hoặc xác nhận. Đọc thêm tại Điều khoản Sử dụng.