OPEN-SOURCE SCRIPT
SS Keltner Line
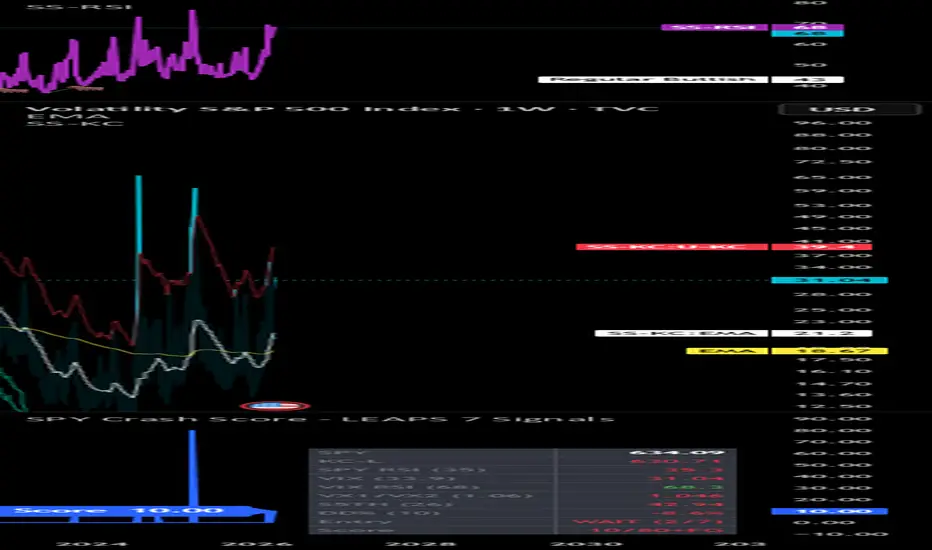
A customised Keltner Channel indicator designed for crash detection and mean-reversion entries on SPY and broad market indices. Unlike standard Keltner Channel implementations, this version uses an asymmetric band structure — a wider upper band for overbought detection and two tiered lower bands to distinguish between moderate and deep oversold conditions.
Band structure:
Upper band — EMA + 2.75 × ATR(10) — blue. Overbought / extended zone
Basis — 20-period EMA — yellow. Mean reversion target / take profit level
Lower band 2.0 — EMA − 2.0 × ATR(10) — green. First oversold zone, initial entry consideration
Lower band 2.5 — EMA − 2.5 × ATR(10) — red. Deep oversold zone, high-conviction entry
Visual fill zones:
Light blue fill between upper band and EMA — extended/overbought territory
Light green fill between EMA and lower 2.0 — mild pullback zone
Light red fill between lower 2.0 and lower 2.5 — deep crash zone, primary LEAPS entry region
Intended use:
On the weekly chart, a SPY close at or below the green lower band (2.0×) forms part of a multi-signal crash entry system. A close into the red zone (2.5×) represents an extreme reading historically associated with maximum fear entries. The EMA basis serves as the primary take-profit target on mean reversion.
Part of the SS LEAPS crash trading system. Best used on weekly timeframe alongside VIX RSI, Fear & Greed, S5TH breadth, and VX1!/VX2! backwardation signals.
Band structure:
Upper band — EMA + 2.75 × ATR(10) — blue. Overbought / extended zone
Basis — 20-period EMA — yellow. Mean reversion target / take profit level
Lower band 2.0 — EMA − 2.0 × ATR(10) — green. First oversold zone, initial entry consideration
Lower band 2.5 — EMA − 2.5 × ATR(10) — red. Deep oversold zone, high-conviction entry
Visual fill zones:
Light blue fill between upper band and EMA — extended/overbought territory
Light green fill between EMA and lower 2.0 — mild pullback zone
Light red fill between lower 2.0 and lower 2.5 — deep crash zone, primary LEAPS entry region
Intended use:
On the weekly chart, a SPY close at or below the green lower band (2.0×) forms part of a multi-signal crash entry system. A close into the red zone (2.5×) represents an extreme reading historically associated with maximum fear entries. The EMA basis serves as the primary take-profit target on mean reversion.
Part of the SS LEAPS crash trading system. Best used on weekly timeframe alongside VIX RSI, Fear & Greed, S5TH breadth, and VX1!/VX2! backwardation signals.
Mã nguồn mở
Theo đúng tinh thần TradingView, tác giả của tập lệnh này đã công bố nó dưới dạng mã nguồn mở, để các nhà giao dịch có thể xem xét và xác minh chức năng. Chúc mừng tác giả! Mặc dù bạn có thể sử dụng miễn phí, hãy nhớ rằng việc công bố lại mã phải tuân theo Nội quy.

Thông báo miễn trừ trách nhiệm
Thông tin và các ấn phẩm này không nhằm mục đích, và không cấu thành, lời khuyên hoặc khuyến nghị về tài chính, đầu tư, giao dịch hay các loại khác do TradingView cung cấp hoặc xác nhận. Đọc thêm tại Điều khoản Sử dụng.
Mã nguồn mở
Theo đúng tinh thần TradingView, tác giả của tập lệnh này đã công bố nó dưới dạng mã nguồn mở, để các nhà giao dịch có thể xem xét và xác minh chức năng. Chúc mừng tác giả! Mặc dù bạn có thể sử dụng miễn phí, hãy nhớ rằng việc công bố lại mã phải tuân theo Nội quy.
Thông báo miễn trừ trách nhiệm
Thông tin và các ấn phẩm này không nhằm mục đích, và không cấu thành, lời khuyên hoặc khuyến nghị về tài chính, đầu tư, giao dịch hay các loại khác do TradingView cung cấp hoặc xác nhận. Đọc thêm tại Điều khoản Sử dụng.