Multi-Timeframe EMA 15m 1H
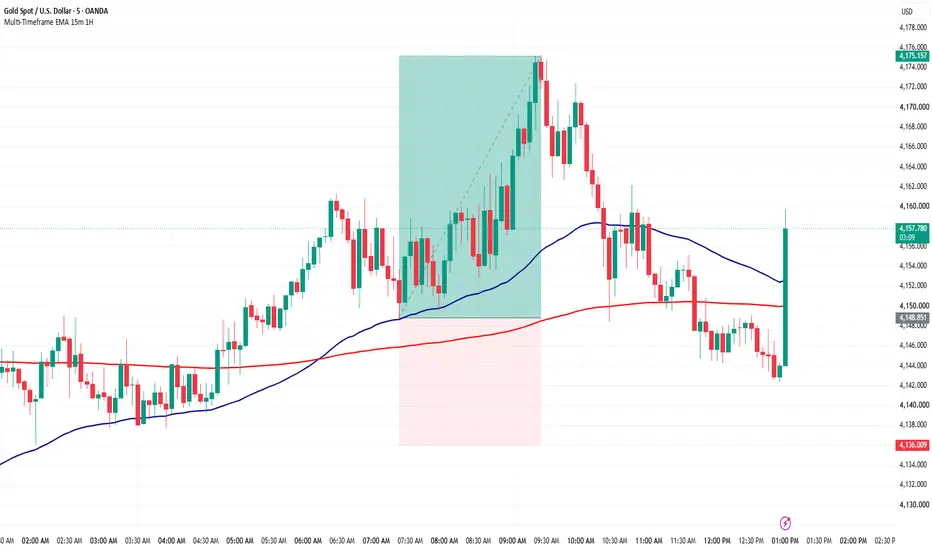
Multi-Timeframe EMA 15m 1H
Multi-Timeframe EMA 15m 1H is a simple trend and pullback framework designed specifically for traders using the 5-minute chart.
The indicator displays two smooth EMA lines:
The default EMA length is 20, and the length can be adjusted from the settings.
The purpose of the indicator is to provide a clean visual framework for studying EMA structure, price direction, pullbacks, retests, and potential trend continuation on the 5-minute chart.
It does not generate automatic buy or sell signals.
Key Features
How to Use
The indicator can be used to study two primary EMA-based setup scenarios.
Scenario 1 — EMA Compression / No Cross
This setup occurs when the 15-minute and 1-hour EMA move close to each other but do not cross.
Bullish Setup
1. The two EMA lines move close together.
2. The EMAs remain on the same side relative to each other and do not cross.
3. Price moves back above both EMA lines.
4. Wait for a 5-minute candle to close above both EMAs.
5. The close can be used as confirmation for a potential long setup.

Bearish Setup
The same concept can be applied in reverse:
1. The two EMA lines move close together.
2. The EMAs do not cross.
3. Price moves below both EMA lines.
4. Wait for a 5-minute candle to close below both EMAs.
5. The close can be used as confirmation for a potential short setup.

Scenario 2 — EMA Cross + Retest
The second setup occurs when the two EMA lines cross.
Rather than entering immediately after the crossover, the approach is to wait for price to return to the EMA area and look for confirmation.
Bullish Setup
1. The 15-minute and 1-hour EMAs cross.
2. Price establishes itself on the bullish side of the EMA structure.
3. Wait for price to return and retest the EMA area.
4. Look for price to react from the area.
5. Enter only after a 5-minute candle closes back in the direction of the trend.

Bearish Setup
The same process applies in reverse:
1. The EMAs cross in a bearish direction.
2. Price establishes itself below the EMA structure.
3. Wait for a retest of the EMA area.
4. Look for bearish rejection or reaction.
5. Wait for a 5-minute candle to close back in the bearish direction before considering the setup.

Recommended Use
This indicator is designed for traders who want a simple visual framework for:
The EMA structure should be considered together with market structure, key levels, volatility, session context, and price action rather than used as a standalone trading system.
Limitations
EMA-based setups can produce false signals, particularly during sideways or highly volatile market conditions.
Possible situations include:
The indicator does not guarantee trade outcomes and does not provide financial advice or automatic buy/sell recommendations.
Multi-Timeframe EMA 15m 1H is a simple trend and pullback framework designed specifically for traders using the 5-minute chart.
The indicator displays two smooth EMA lines:
- Dark Blue — 15-minute EMA
- Red — 1-hour EMA
The default EMA length is 20, and the length can be adjusted from the settings.
The purpose of the indicator is to provide a clean visual framework for studying EMA structure, price direction, pullbacks, retests, and potential trend continuation on the 5-minute chart.
It does not generate automatic buy or sell signals.
Key Features
- 15-minute EMA
- 1-hour EMA
- Adjustable EMA length
- Default EMA length of 20
- Independent visibility controls
- Customizable EMA colors
- Smooth EMA lines
- Designed specifically for the 5-minute chart
- Clean and minimal chart presentation
How to Use
The indicator can be used to study two primary EMA-based setup scenarios.
Scenario 1 — EMA Compression / No Cross
This setup occurs when the 15-minute and 1-hour EMA move close to each other but do not cross.
Bullish Setup
1. The two EMA lines move close together.
2. The EMAs remain on the same side relative to each other and do not cross.
3. Price moves back above both EMA lines.
4. Wait for a 5-minute candle to close above both EMAs.
5. The close can be used as confirmation for a potential long setup.
Bearish Setup
The same concept can be applied in reverse:
1. The two EMA lines move close together.
2. The EMAs do not cross.
3. Price moves below both EMA lines.
4. Wait for a 5-minute candle to close below both EMAs.
5. The close can be used as confirmation for a potential short setup.
Scenario 2 — EMA Cross + Retest
The second setup occurs when the two EMA lines cross.
Rather than entering immediately after the crossover, the approach is to wait for price to return to the EMA area and look for confirmation.
Bullish Setup
1. The 15-minute and 1-hour EMAs cross.
2. Price establishes itself on the bullish side of the EMA structure.
3. Wait for price to return and retest the EMA area.
4. Look for price to react from the area.
5. Enter only after a 5-minute candle closes back in the direction of the trend.
Bearish Setup
The same process applies in reverse:
1. The EMAs cross in a bearish direction.
2. Price establishes itself below the EMA structure.
3. Wait for a retest of the EMA area.
4. Look for bearish rejection or reaction.
5. Wait for a 5-minute candle to close back in the bearish direction before considering the setup.
Recommended Use
This indicator is designed for traders who want a simple visual framework for:
- Trend analysis
- EMA compression
- EMA crossovers
- Pullback analysis
- Retest setups
- Potential trend continuation
- 5-minute price-action confirmation
The EMA structure should be considered together with market structure, key levels, volatility, session context, and price action rather than used as a standalone trading system.
Limitations
EMA-based setups can produce false signals, particularly during sideways or highly volatile market conditions.
Possible situations include:
- Failed EMA crosses
- Failed retests
- False breakouts
- Temporary moves above or below the EMA structure
- Rapid reversals
- Extended periods of EMA compression
The indicator does not guarantee trade outcomes and does not provide financial advice or automatic buy/sell recommendations.

TradingAnalysis.ai — Analyze Better, Trade Smarter.
Market outlooks, key levels & actionable scenarios for traders.
🔗 tradinganalysis.ai
Market outlooks, key levels & actionable scenarios for traders.
🔗 tradinganalysis.ai
Thông báo miễn trừ trách nhiệm
Thông tin và các ấn phẩm này không nhằm mục đích, và không cấu thành, lời khuyên hoặc khuyến nghị về tài chính, đầu tư, giao dịch hay các loại khác do TradingView cung cấp hoặc xác nhận. Đọc thêm tại Điều khoản Sử dụng.
TradingAnalysis.ai — Analyze Better, Trade Smarter.
Market outlooks, key levels & actionable scenarios for traders.
🔗 tradinganalysis.ai
Market outlooks, key levels & actionable scenarios for traders.
🔗 tradinganalysis.ai
Thông báo miễn trừ trách nhiệm
Thông tin và các ấn phẩm này không nhằm mục đích, và không cấu thành, lời khuyên hoặc khuyến nghị về tài chính, đầu tư, giao dịch hay các loại khác do TradingView cung cấp hoặc xác nhận. Đọc thêm tại Điều khoản Sử dụng.