Copper vs Cu/Au Decomposition
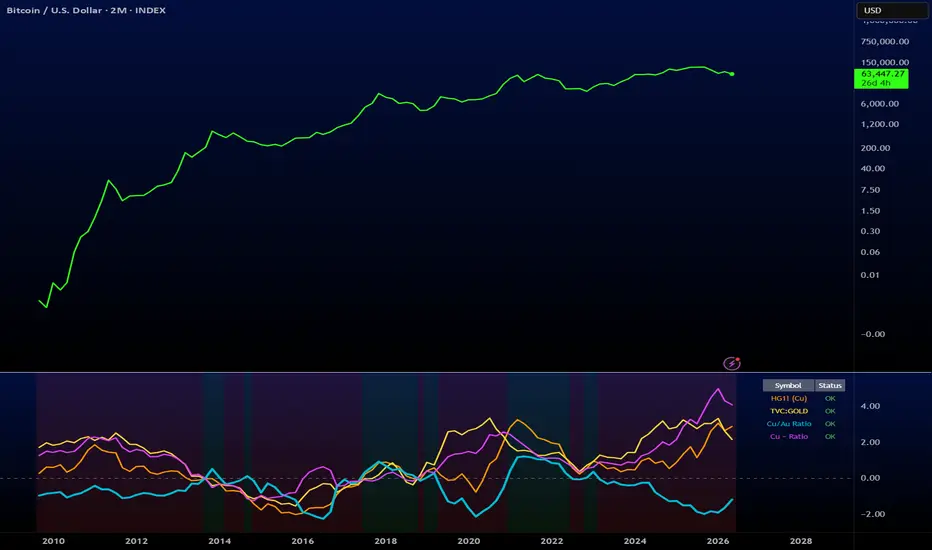
Copper vs Cu/Au Decomposition
Overview
The copper-to-gold ratio (Cu/Au) is a widely followed macro signal, used as a proxy for global growth expectations, risk appetite, and the direction of long-end yields. The intuition is simple: copper demand rises with industrial activity, gold demand rises with monetary and geopolitical stress, so the ratio of the two encodes the balance between growth-on and defense-on regimes.
But the ratio has a structural blind spot. Because it is a quotient of two independently moving series, it cannot tell you which leg is doing the work. A rising Cu/Au can mean copper is rallying on real demand — or it can mean gold is selling off on a hawkish surprise, with copper doing nothing. A falling Cu/Au can mean genuine growth weakness — or it can mean copper is strong but gold is even stronger, masking the signal. Same number, very different stories, very different trades.
This indicator decomposes the Cu/Au ratio into its components so you can see which side is actually driving it, and adds a derived line that explicitly measures when gold is distorting the signal.
What it plots
All series are sampled on the monthly timeframe regardless of chart timeframe, z-score normalized over a configurable rolling lookback (default 60 months), and lightly EMA-smoothed (default length 3).
How to read it
The three primary lines tell you what each leg is doing. The magenta spread tells you whether the ratio is being honest about copper.
The four canonical scenarios
Why the spread matters
The Cu/Au ratio loses information whenever gold moves independently of copper. The spread quantifies that lost information as a single readable number. When it sits near zero, no information is being lost — copper and the ratio are saying the same thing. When it deviates, the ratio is failing as a copper proxy and you need to step around it to the underlying components. The spread does that decomposition explicitly so you don't have to mentally subtract two z-scores while reading the chart in real time.
Inputs
Notes
Credits and concept
Built for traders who use Cu/Au as a macro signal but want to know when the signal is being distorted by gold-side moves. The decomposition framework draws on the standard observation in commodity macro that ratio-based indicators carry hidden denominator risk, and operationalizes that observation as a single readable diagnostic line.
Overview
The copper-to-gold ratio (Cu/Au) is a widely followed macro signal, used as a proxy for global growth expectations, risk appetite, and the direction of long-end yields. The intuition is simple: copper demand rises with industrial activity, gold demand rises with monetary and geopolitical stress, so the ratio of the two encodes the balance between growth-on and defense-on regimes.
But the ratio has a structural blind spot. Because it is a quotient of two independently moving series, it cannot tell you which leg is doing the work. A rising Cu/Au can mean copper is rallying on real demand — or it can mean gold is selling off on a hawkish surprise, with copper doing nothing. A falling Cu/Au can mean genuine growth weakness — or it can mean copper is strong but gold is even stronger, masking the signal. Same number, very different stories, very different trades.
This indicator decomposes the Cu/Au ratio into its components so you can see which side is actually driving it, and adds a derived line that explicitly measures when gold is distorting the signal.
What it plots
All series are sampled on the monthly timeframe regardless of chart timeframe, z-score normalized over a configurable rolling lookback (default 60 months), and lightly EMA-smoothed (default length 3).
- Copper z-score — HG1! monthly close, position within its own 5-year distribution. Orange.
- Gold z-score — TVC:GOLD monthly close, same treatment. Yellow.
- Cu/Au ratio z-score — the ratio HG1!/TVC:GOLD, with both legs sampled on the same monthly bar (via nested request.security) before the ratio is formed and z-scored. Aqua, heavier linewidth as the headline series.
- Copper minus Ratio spread — the difference between copper's absolute z-position and its relative z-position. Magenta, optional, default off. This is the diagnostic line.
- A dashed zero line, light green/red background tint keyed to the ratio's sign, and a status table confirming each symbol loaded round out the display. All four lines have independent show/hide toggles.
How to read it
The three primary lines tell you what each leg is doing. The magenta spread tells you whether the ratio is being honest about copper.
- Spread near zero — the ratio is faithfully reporting copper. Read Cu/Au at face value.
- Spread positive and rising — copper is stronger than the ratio shows; gold strength is masking it. Lean long copper but don't trust ratio-based signals.
- Spread negative and falling — the ratio is overstating copper; the move is really a short-gold story. Fade ratio-based copper longs.
The four canonical scenarios
- Clean cyclical turn: copper rises, gold flat, ratio rises, spread near zero. All signals agree, ratio is honest, high-confidence growth-on tape.
- Masked copper strength: copper rises, gold rises harder, ratio flat or falling, spread sharply positive. The ratio is hiding real copper strength behind a stronger gold leg.
- Fake copper signal from gold weakness: copper flat, gold falling hard, ratio rises, spread sharply negative. The ratio looks bullish copper but it's actually a short-gold story misrepresented.
- Confirmed risk-off: copper falls, gold rises, ratio falls hard, spread roughly flat. Both legs agree on defense, ratio is honest.
Why the spread matters
The Cu/Au ratio loses information whenever gold moves independently of copper. The spread quantifies that lost information as a single readable number. When it sits near zero, no information is being lost — copper and the ratio are saying the same thing. When it deviates, the ratio is failing as a copper proxy and you need to step around it to the underlying components. The spread does that decomposition explicitly so you don't have to mentally subtract two z-scores while reading the chart in real time.
Inputs
- Z-Score Lookback (default 60) — rolling window for mean and standard deviation, expressed in monthly bars
- EMA Smoothing Length (default 3) — applied to each z-score series after normalization
- Source Timeframe (default M) — the timeframe at which all symbols are sampled
- Display toggles — independent show/hide for copper, gold, ratio, spread, background tint, and status table
Notes
- Data is fetched with gaps=barmerge.gaps_off and ignore_invalid_symbol=true, so the indicator handles missing bars gracefully and won't break if a symbol fails to load.
- All calculations are non-repainting (lookahead=barmerge.lookahead_off, the default).
- Best used on weekly or daily charts where the monthly resampling gives meaningful resolution. Below daily, the monthly values will appear as long flat segments.
- The ratio z-score is computed from monthly samples of both legs, not from the chart-level ratio, so the rolling window represents 60 genuine monthly observations rather than 60 stepped chart bars.
Credits and concept
Built for traders who use Cu/Au as a macro signal but want to know when the signal is being distorted by gold-side moves. The decomposition framework draws on the standard observation in commodity macro that ratio-based indicators carry hidden denominator risk, and operationalizes that observation as a single readable diagnostic line.

Thông báo miễn trừ trách nhiệm
Thông tin và các ấn phẩm này không nhằm mục đích, và không cấu thành, lời khuyên hoặc khuyến nghị về tài chính, đầu tư, giao dịch hay các loại khác do TradingView cung cấp hoặc xác nhận. Đọc thêm tại Điều khoản Sử dụng.
Thông báo miễn trừ trách nhiệm
Thông tin và các ấn phẩm này không nhằm mục đích, và không cấu thành, lời khuyên hoặc khuyến nghị về tài chính, đầu tư, giao dịch hay các loại khác do TradingView cung cấp hoặc xác nhận. Đọc thêm tại Điều khoản Sử dụng.