OPEN-SOURCE SCRIPT
Seasonality: U.S. Treasuries [invincible3]
Seasonality: U.S. Treasuries [invincible3]
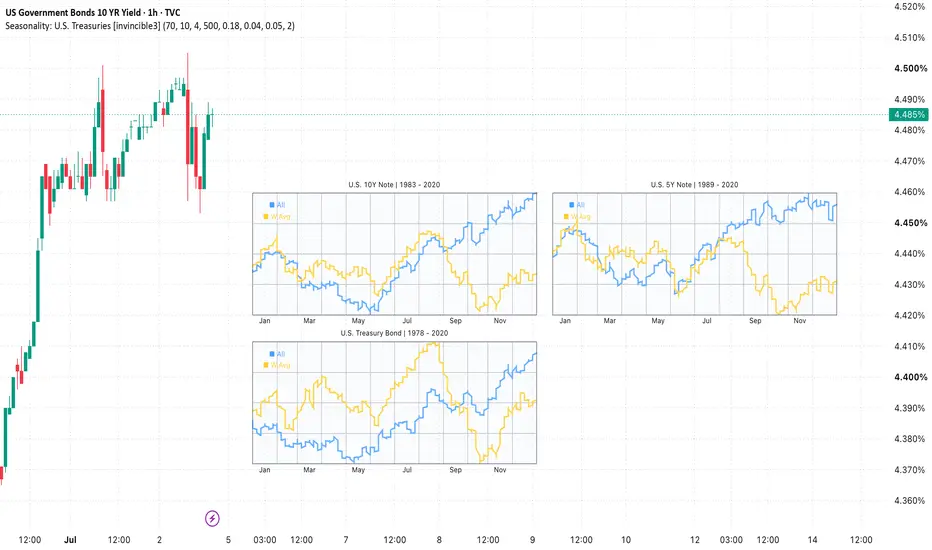
Seasonality: U.S. Treasuries is a visual dashboard-style indicator designed to display historical seasonal tendencies for major U.S. Treasury futures directly on the price chart.
The indicator includes three separate seasonal mini-charts:
Each panel shows a full 365-day seasonal curve, allowing traders to observe how these Treasury instruments have historically behaved throughout the calendar year. The indicator plots both the long-term **All Years average** and a **Weighted Average** curve, making it easier to compare broad historical behavior with a more weighted seasonal tendency.
The dashboard is built to be clean, compact, and flexible. Users can adjust the widget width, distance from candles, panel height, row spacing, column gap, and placement on either the right or left side of the chart. This helps keep the seasonal panels separated from price action while still making the seasonal structure easy to read.
Automatic theme detection is included, so the dashboard adapts to both dark and light TradingView chart themes. Users can also manually customize colors for the grid, background, text, All Years line, and Weighted Average line.
This indicator is useful for traders, analysts, and macro-market observers who want to study historical seasonal patterns in U.S. Treasury markets and compare current market behavior with long-term seasonal tendencies.
Key Features:
This indicator is intended for educational and analytical purposes only. It does not provide financial advice, investment recommendations, or direct buy/sell signals. Seasonal tendencies are based on historical data and do not guarantee future market performance.
Seasonality: U.S. Treasuries is a visual dashboard-style indicator designed to display historical seasonal tendencies for major U.S. Treasury futures directly on the price chart.
The indicator includes three separate seasonal mini-charts:
- U.S. 10-Year Treasury Note — seasonal data from 1983 to 2020
- U.S. 5-Year Treasury Note — seasonal data from 1989 to 2020
- U.S. Treasury Bond — seasonal data from 1978 to 2020
Each panel shows a full 365-day seasonal curve, allowing traders to observe how these Treasury instruments have historically behaved throughout the calendar year. The indicator plots both the long-term **All Years average** and a **Weighted Average** curve, making it easier to compare broad historical behavior with a more weighted seasonal tendency.
The dashboard is built to be clean, compact, and flexible. Users can adjust the widget width, distance from candles, panel height, row spacing, column gap, and placement on either the right or left side of the chart. This helps keep the seasonal panels separated from price action while still making the seasonal structure easy to read.
Automatic theme detection is included, so the dashboard adapts to both dark and light TradingView chart themes. Users can also manually customize colors for the grid, background, text, All Years line, and Weighted Average line.
This indicator is useful for traders, analysts, and macro-market observers who want to study historical seasonal patterns in U.S. Treasury markets and compare current market behavior with long-term seasonal tendencies.
Key Features:
- Seasonal mini-dashboard for U.S. Treasury markets
- Includes 10Y Note, 5Y Note, and Treasury Bond
- 365-day seasonal curves
- All Years average line
- Weighted Average line
- Adjustable widget size and placement
- Clean layout placed away from candles
- Auto dark/light theme support
- Manual color customization
- Designed for visual seasonal analysis
This indicator is intended for educational and analytical purposes only. It does not provide financial advice, investment recommendations, or direct buy/sell signals. Seasonal tendencies are based on historical data and do not guarantee future market performance.
Mã nguồn mở
Theo đúng tinh thần TradingView, tác giả của tập lệnh này đã công bố nó dưới dạng mã nguồn mở, để các nhà giao dịch có thể xem xét và xác minh chức năng. Chúc mừng tác giả! Mặc dù bạn có thể sử dụng miễn phí, hãy nhớ rằng việc công bố lại mã phải tuân theo Nội quy.

Thông báo miễn trừ trách nhiệm
Thông tin và các ấn phẩm này không nhằm mục đích, và không cấu thành, lời khuyên hoặc khuyến nghị về tài chính, đầu tư, giao dịch hay các loại khác do TradingView cung cấp hoặc xác nhận. Đọc thêm tại Điều khoản Sử dụng.
Mã nguồn mở
Theo đúng tinh thần TradingView, tác giả của tập lệnh này đã công bố nó dưới dạng mã nguồn mở, để các nhà giao dịch có thể xem xét và xác minh chức năng. Chúc mừng tác giả! Mặc dù bạn có thể sử dụng miễn phí, hãy nhớ rằng việc công bố lại mã phải tuân theo Nội quy.
Thông báo miễn trừ trách nhiệm
Thông tin và các ấn phẩm này không nhằm mục đích, và không cấu thành, lời khuyên hoặc khuyến nghị về tài chính, đầu tư, giao dịch hay các loại khác do TradingView cung cấp hoặc xác nhận. Đọc thêm tại Điều khoản Sử dụng.