OR Box + 15m EMA Reversal Signals (5m)
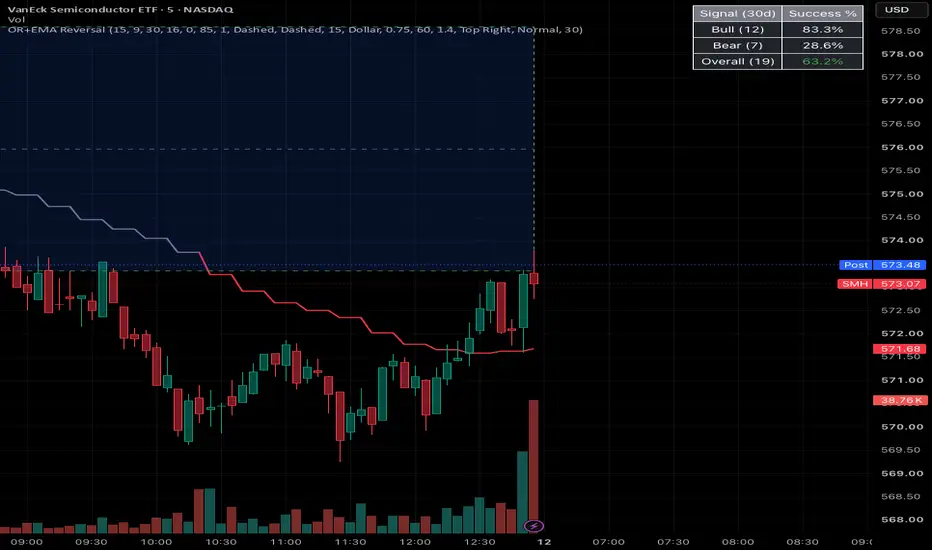
A confluence-based reversal indicator built for 5-minute charts on SPY, QQQ, IWM, and SMH. It combines the opening range, a 15-minute EMA, and a two-step confirmation process to flag potential trend-continuation entries off intraday pullbacks.
How it works
Opening Range Box — Captures the high/low of the first 15 minutes of the regular session (9:30–9:45 AM ET by default, fully configurable) using true 1-minute data for accuracy regardless of your chart's timeframe. Each day gets its own box, drawn and color-coded, that stays fixed at its own historical price levels going forward.
15-Minute EMA — Plotted directly on the 5-minute chart via a multi-timeframe pull, colored green when the setup is bullish-armed, red when bearish-armed, and gray when neutral.
Armed state — The setup arms when the 15m EMA closes outside the opening range box (above for bullish, below for bearish). It disarms if price closes back inside the box or if the EMA itself drifts back into/through the box.
Touch + confirmation — While armed, a pullback candle touching the EMA on the 5-minute chart arms a pending signal. That signal only becomes a real, plotted arrow once the 15-minute candle containing that touch shows the same reversal pattern — a wick crossing the EMA with the close settling back on the trend side. This two-step check is designed to filter out weaker, single-timeframe pullbacks.
Trade validation — Every confirmed signal is tracked forward automatically: a green checkmark if price hits your configured target (dollar or percentage) before closing back through the EMA, or a red circle-slash if it doesn't (including a timeout after a configurable number of bars). A built-in success-rate table shows Bull/Bear/Overall win rates, filterable to a rolling lookback window or all-time.
Fully customizable: opening range window and session times, box/midline appearance, EMA length and colors, signal arrow colors, target type and size, label spacing, and table position/size.
⚠️ This indicator is for educational and informational purposes only. It does not constitute financial advice. Past signal performance shown in the success-rate table does not guarantee future results. Always do your own research and manage risk appropriately.
How it works
Opening Range Box — Captures the high/low of the first 15 minutes of the regular session (9:30–9:45 AM ET by default, fully configurable) using true 1-minute data for accuracy regardless of your chart's timeframe. Each day gets its own box, drawn and color-coded, that stays fixed at its own historical price levels going forward.
15-Minute EMA — Plotted directly on the 5-minute chart via a multi-timeframe pull, colored green when the setup is bullish-armed, red when bearish-armed, and gray when neutral.
Armed state — The setup arms when the 15m EMA closes outside the opening range box (above for bullish, below for bearish). It disarms if price closes back inside the box or if the EMA itself drifts back into/through the box.
Touch + confirmation — While armed, a pullback candle touching the EMA on the 5-minute chart arms a pending signal. That signal only becomes a real, plotted arrow once the 15-minute candle containing that touch shows the same reversal pattern — a wick crossing the EMA with the close settling back on the trend side. This two-step check is designed to filter out weaker, single-timeframe pullbacks.
Trade validation — Every confirmed signal is tracked forward automatically: a green checkmark if price hits your configured target (dollar or percentage) before closing back through the EMA, or a red circle-slash if it doesn't (including a timeout after a configurable number of bars). A built-in success-rate table shows Bull/Bear/Overall win rates, filterable to a rolling lookback window or all-time.
Fully customizable: opening range window and session times, box/midline appearance, EMA length and colors, signal arrow colors, target type and size, label spacing, and table position/size.
⚠️ This indicator is for educational and informational purposes only. It does not constitute financial advice. Past signal performance shown in the success-rate table does not guarantee future results. Always do your own research and manage risk appropriately.

Thông báo miễn trừ trách nhiệm
Thông tin và các ấn phẩm này không nhằm mục đích, và không cấu thành, lời khuyên hoặc khuyến nghị về tài chính, đầu tư, giao dịch hay các loại khác do TradingView cung cấp hoặc xác nhận. Đọc thêm tại Điều khoản Sử dụng.
Thông báo miễn trừ trách nhiệm
Thông tin và các ấn phẩm này không nhằm mục đích, và không cấu thành, lời khuyên hoặc khuyến nghị về tài chính, đầu tư, giao dịch hay các loại khác do TradingView cung cấp hoặc xác nhận. Đọc thêm tại Điều khoản Sử dụng.