OPEN-SOURCE SCRIPT
Weekly 30 SMA + 30 EMA Ribbon + Spread SD
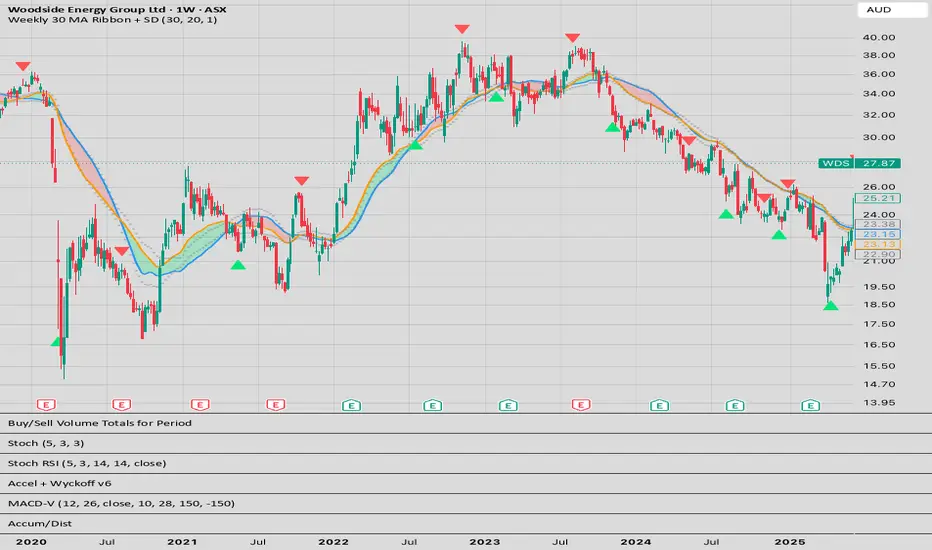
Description
Classic 30-week moving average ribbon (Stan Weinstein / Stage Analysis style) with added Spread + Standard Deviation bands for volatility awareness.
Key Features
True Weekly 30 SMA & 30 EMA (your 30-week MA)
Colored ribbon between the two MAs (Red when SMA > EMA, Green when EMA > SMA)
Spread ± Standard Deviation bands (default 20-period)
Visual cross markers
Works best on Daily or Weekly charts
How to Use
Best viewed on Daily or Weekly charts.
Green ribbon = EMA above SMA (bullish trend support in Stage 2 - RED FLAG indicators crossover).
Red ribbon = SMA above EMA (bearish or distribution - GREEN FLAG indicators crossover) - [I forgot to change the flag colours to match, you can do this adjustment yourself.]
Monitor how far the ribbon stretches relative to the SD bands — wide spreads often precede mean reversion or acceleration.
Adjust SD Length for more/less sensitivity (20 is balanced).
Pros
Directly implements the popular 30-week MA concept
SD bands add objective volatility context to traditional stage analysis
Excellent for identifying accumulation/distribution phases and trend strength
Clean and not over-cluttered
Cons / Limitations
Weekly data updates more slowly (less useful for very short-term trading)
Color scheme is intentionally swapped — users may need a short adjustment period
Like all MA tools, it lags price and works best in trending markets
Classic 30-week moving average ribbon (Stan Weinstein / Stage Analysis style) with added Spread + Standard Deviation bands for volatility awareness.
Key Features
True Weekly 30 SMA & 30 EMA (your 30-week MA)
Colored ribbon between the two MAs (Red when SMA > EMA, Green when EMA > SMA)
Spread ± Standard Deviation bands (default 20-period)
Visual cross markers
Works best on Daily or Weekly charts
How to Use
Best viewed on Daily or Weekly charts.
Green ribbon = EMA above SMA (bullish trend support in Stage 2 - RED FLAG indicators crossover).
Red ribbon = SMA above EMA (bearish or distribution - GREEN FLAG indicators crossover) - [I forgot to change the flag colours to match, you can do this adjustment yourself.]
Monitor how far the ribbon stretches relative to the SD bands — wide spreads often precede mean reversion or acceleration.
Adjust SD Length for more/less sensitivity (20 is balanced).
Pros
Directly implements the popular 30-week MA concept
SD bands add objective volatility context to traditional stage analysis
Excellent for identifying accumulation/distribution phases and trend strength
Clean and not over-cluttered
Cons / Limitations
Weekly data updates more slowly (less useful for very short-term trading)
Color scheme is intentionally swapped — users may need a short adjustment period
Like all MA tools, it lags price and works best in trending markets
Mã nguồn mở
Theo đúng tinh thần TradingView, tác giả của tập lệnh này đã công bố nó dưới dạng mã nguồn mở, để các nhà giao dịch có thể xem xét và xác minh chức năng. Chúc mừng tác giả! Mặc dù bạn có thể sử dụng miễn phí, hãy nhớ rằng việc công bố lại mã phải tuân theo Nội quy.

Thông báo miễn trừ trách nhiệm
Thông tin và các ấn phẩm này không nhằm mục đích, và không cấu thành, lời khuyên hoặc khuyến nghị về tài chính, đầu tư, giao dịch hay các loại khác do TradingView cung cấp hoặc xác nhận. Đọc thêm tại Điều khoản Sử dụng.
Mã nguồn mở
Theo đúng tinh thần TradingView, tác giả của tập lệnh này đã công bố nó dưới dạng mã nguồn mở, để các nhà giao dịch có thể xem xét và xác minh chức năng. Chúc mừng tác giả! Mặc dù bạn có thể sử dụng miễn phí, hãy nhớ rằng việc công bố lại mã phải tuân theo Nội quy.
Thông báo miễn trừ trách nhiệm
Thông tin và các ấn phẩm này không nhằm mục đích, và không cấu thành, lời khuyên hoặc khuyến nghị về tài chính, đầu tư, giao dịch hay các loại khác do TradingView cung cấp hoặc xác nhận. Đọc thêm tại Điều khoản Sử dụng.