LoD Split Exit & Position Sizer
LoD Split Exit & Position Sizer
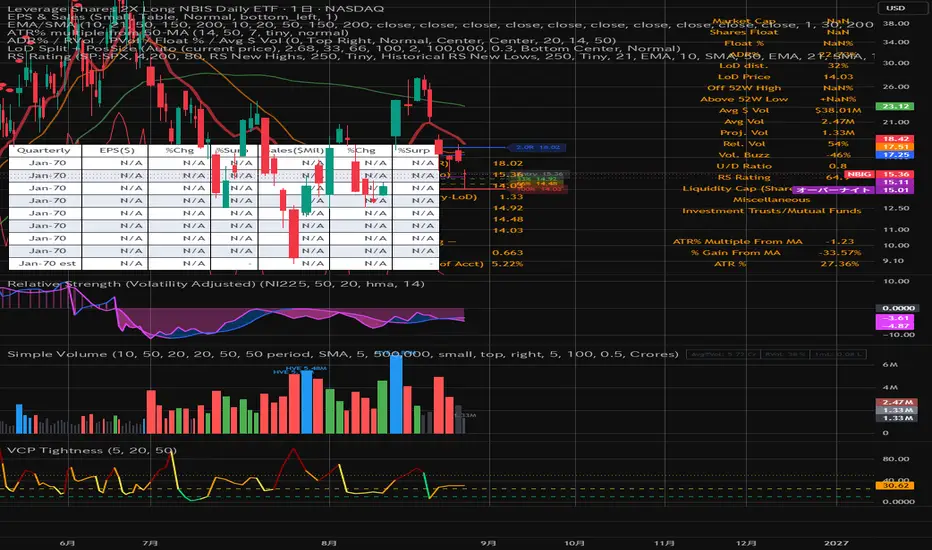
This indicator helps swing and momentum traders plan trades around the current day's Low of Day (LoD). It draws a staged (scaled) stop-loss plan, a take-profit target based on your risk unit (R), and calculates the maximum position size that keeps your total risk within a defined percentage of your account.
What it does
The core idea is to treat the distance from your entry price down to the Low of Day as your risk unit, or "R". Everything else — the staged stops, the take-profit target, and the position size — is derived from this single risk measurement.
The indicator lets you exit a losing position in three stages rather than all at once. By default it plots stop levels at 33%, 66%, and 100% of the way down from your entry to the LoD, but all three levels are fully adjustable. Assuming you close one third of the position at each stage, the average (effective) loss works out to roughly 0.66R with the default settings, which the indicator uses in its position-sizing math.
Main features
Entry Price Mode. You can choose between two modes. In Auto (current price) mode, the default, the indicator pulls the live chart price as your entry. In Manual (actual fill price) mode, you type in the exact price at which you were filled, so the lines reflect your real trade rather than the current market price. If the manual field is left at zero, it safely falls back to the current price.
Staged stop-loss levels. Three configurable exit levels (default 33 / 66 / 100 percent of the entry-to-LoD range) are drawn as horizontal lines with price labels. The 100% level sits exactly at the Low of Day.
Take-profit line. A target line is plotted at a chosen R multiple above your entry (default 2R). You can toggle it on or off and change the multiple.
Position sizing (percentage). Based on your account size and your maximum allowed risk per position (default 0.3%), the indicator computes the largest position you can hold while keeping the effective staged loss within that risk limit. The result is shown as a percentage of your account, so you instantly see how much of your capital the trade should represent.
Customizable table. A summary table shows the take-profit price, entry price (labeled Auto or Manual), the LoD, the risk width, each stop price, the effective loss factor, and the maximum position percentage. The table can be placed in any of six positions — top left, top center, top right, bottom left, bottom center, or bottom right — and its text color, size, and background are adjustable.
How the position size is calculated
The maximum dollar risk is your account size multiplied by your risk percentage. The effective loss per share is the risk width (entry minus LoD) multiplied by the average of your three stop levels. Dividing the maximum dollar risk by the effective loss per share gives the maximum number of shares, which is then expressed as a percentage of your account value.
This indicator helps swing and momentum traders plan trades around the current day's Low of Day (LoD). It draws a staged (scaled) stop-loss plan, a take-profit target based on your risk unit (R), and calculates the maximum position size that keeps your total risk within a defined percentage of your account.
What it does
The core idea is to treat the distance from your entry price down to the Low of Day as your risk unit, or "R". Everything else — the staged stops, the take-profit target, and the position size — is derived from this single risk measurement.
The indicator lets you exit a losing position in three stages rather than all at once. By default it plots stop levels at 33%, 66%, and 100% of the way down from your entry to the LoD, but all three levels are fully adjustable. Assuming you close one third of the position at each stage, the average (effective) loss works out to roughly 0.66R with the default settings, which the indicator uses in its position-sizing math.
Main features
Entry Price Mode. You can choose between two modes. In Auto (current price) mode, the default, the indicator pulls the live chart price as your entry. In Manual (actual fill price) mode, you type in the exact price at which you were filled, so the lines reflect your real trade rather than the current market price. If the manual field is left at zero, it safely falls back to the current price.
Staged stop-loss levels. Three configurable exit levels (default 33 / 66 / 100 percent of the entry-to-LoD range) are drawn as horizontal lines with price labels. The 100% level sits exactly at the Low of Day.
Take-profit line. A target line is plotted at a chosen R multiple above your entry (default 2R). You can toggle it on or off and change the multiple.
Position sizing (percentage). Based on your account size and your maximum allowed risk per position (default 0.3%), the indicator computes the largest position you can hold while keeping the effective staged loss within that risk limit. The result is shown as a percentage of your account, so you instantly see how much of your capital the trade should represent.
Customizable table. A summary table shows the take-profit price, entry price (labeled Auto or Manual), the LoD, the risk width, each stop price, the effective loss factor, and the maximum position percentage. The table can be placed in any of six positions — top left, top center, top right, bottom left, bottom center, or bottom right — and its text color, size, and background are adjustable.
How the position size is calculated
The maximum dollar risk is your account size multiplied by your risk percentage. The effective loss per share is the risk width (entry minus LoD) multiplied by the average of your three stop levels. Dividing the maximum dollar risk by the effective loss per share gives the maximum number of shares, which is then expressed as a percentage of your account value.

Thông báo miễn trừ trách nhiệm
Thông tin và các ấn phẩm này không nhằm mục đích, và không cấu thành, lời khuyên hoặc khuyến nghị về tài chính, đầu tư, giao dịch hay các loại khác do TradingView cung cấp hoặc xác nhận. Đọc thêm tại Điều khoản Sử dụng.
Thông báo miễn trừ trách nhiệm
Thông tin và các ấn phẩm này không nhằm mục đích, và không cấu thành, lời khuyên hoặc khuyến nghị về tài chính, đầu tư, giao dịch hay các loại khác do TradingView cung cấp hoặc xác nhận. Đọc thêm tại Điều khoản Sử dụng.